Expanding NPS screening capabilities in the forensic toxicology laboratory
Screen for over 900 compounds using the vMethod application on the SCIEX X500R QTOF system
Pierre Negri
SCIEX, USA
Abstract
Here, the workflow highlighted in the vMethod was used for the full characterization of 130 new and prevalent NPS that have recently emerged on the recreational drug market. Parameters such as retention times, linear correlation, inter-and intra-day precision and accuracy were determined in human urine and whole blood matrices. In addition, detailed structural information in the form of fragment-rich, TOF-MS/MS spectra was collected for each of the analytes using neat standards and matched against the spectra collected to confirm identification of structurally related analytes (including isomeric species) in matrix. The presented workflow enhances the screening capabilities of relevant NPS on the SCIEX X500R QTOF system and provides an updated list of relevant NPS that can be used for both targeted and untargeted data processing, while also providing the ability to retrospective analyze previously-acquired MS and MS/MS data sets and screen for the presence of these new substances without having to re-inject samples.
Introduction
The emergence and rising number of novel psychoactive substances (NPS) on the recreational drug market continues to pose health and safety challenges worldwide. NPS are a class of intoxicating substances that are designed to mimic the effects of controlled drugs. They are usually classified into 4 major groups: synthetic hallucinogens, synthetic cannabinoids, synthetic stimulants and synthetic depressants, which include synthetic opioids and benzodiazepines. This simplistic classification, however, does not take into consideration their wide variety of chemical, metabolic, toxicity and potency properties, nor does it address their overall risk profiles and the complexity of their combined effects. In addition, the frequency at which new NPS enter the drug market, the lack of knowledge about their composition, purity and potency, combined with the limited availability of reference analytical standards to provide confirmatory testing in the forensic toxicological laboratories makes it increasingly more challenging to screen and monitor NPS. As more of these NPS emerge on the illegal drug market, timely screening approaches for the accurate detection and identification of these substances are needed.
The SCIEX vMethod application for forensic toxicology screening on the X500R QTOF system provides a comprehensive workflow for sample preparation and LC-MS/MS detection of 664 forensic compounds, including many NPS, in biological matrices in a single injection method.1 The use of high-resolution instrumentation in the forensic toxicology laboratory, such as the X500R QTOF system, has provided a unique tool for screening unknown compounds such as NPS in complex biological samples with little or no method optimization required. The ability to acquire accurate mass information on all precursor ions, followed by the acquisition of multiple, dependent and analyte-specific MS/MS spectra provides confident identification, confirmation and/or library matching of known or newly emerged substances in a routine testing laboratory environment.
In this technical note, the workflow highlighted in the vMethod was expanded to include the full characterization of 130 new and prevalent NPS that have recently emerged on the recreational drug market. Parameters such as retention times, linear correlation and inter-and intra-day precision and accuracy were determined in human urine and whole blood matrices. In addition, detailed structural information in the form of fragment-rich TOF MS/MS spectra was collected for each of the analytes using neat standards and matched against the spectra collected to confirm identification of structurally related analytes, including isomeric species, in matrix. The presented workflow enhances the screening capabilities of relevant NPS on the X500R QTOF system and provides an updated list of relevant NPS that can be used for both targeted and untargeted data processing. This workflow also provides the ability to perform retrospective analyses on previously acquired MS and MS/MS datasets to screen for the presence of these new substances without having to re-inject samples.
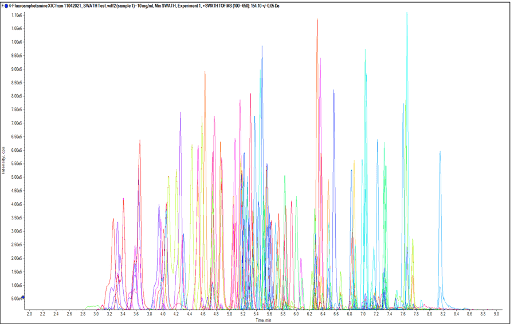
Figure 1. Chromatographic profile of the 130 NPS targeted in this study using the LC conditions of the SCIEX vMethod™ application for forensic toxicology screening on the X500R QTOF system. Extracted ion chromatogram (XIC) resulting from the near baseline separation of the 130 NPS in a 9.5-minute gradient.
Advantages of the vMethod for NPS screening and identification
- The vMethod application for forensic toxicology screening on the X500R QTOF system provides:
- A comprehensive solution for screening NPS with sample preparation procedures for both human whole blood and urine, detailed LC conditions and MS/MS detection methods
- A robust data processing method to confidently monitor and identify new NPS
- A panel of 130 relevant NPS was analyzed using the vMethod conditions to determine retention times and generate structural information in the form of fragment-rich TOF MS/MS spectra, enabling the confident identification of structurally related NPS isomers
- A components table including the compound name, formula, precursor mass and retention time for the 130 NPS was generated
- The list can be downloaded and directly imported into the data processing method in SCIEX OS software and used for both targeted and untargeted data processing to identify NPS in authentic case samples
- The updated list can be used for retrospective analysis of previously acquired MS and MS/MS datasets to screen for the presence of NPS without having to re-inject samples
- The presented workflow provides a significant update that now allows X500R QTOF system users to screen for more than 900 compounds in biological matrices in a single injection method
Experimental details
Target analytes: The target analytes comprised 130 NPS compounds, of which 22 were stimulants, 16 were hallucinogens, 6 were dissociatives, 45 were synthetic opioids, 13 were benzodiazepines, and 28 were synthetic cannabinoids (including cannabinoids), curated based on NPS trends and monitoring information. Reference and internal standards were purchased from Cerilliant Corporation (Round Rock, TX) and Cayman Chemical Company (Ann Arbor, MI). A sample solution was prepared in water with a 1 µg/mL of standard mixture containing the 130 target analytes. A 10 ng/mL standard solution was prepared in water with a mixture containing the 10 internal standards. The neat standard mixture was used to determine the retention time of the 130 components and generate a custom-built spectral library of high-quality TOF MS/MS spectra.
Calibrator preparation: 90 µL samples of human urine or whole blood were fortified with 10 µL of the 1 µg/mL standard mixture containing the 130 NPS. These freshly spiked biological matrix solutions were used to prepare 2 sets of 6 calibrator solutions in each of the 2 biological matrices covering concentrations ranging from 0.1 to 100 ng/mL.
Sample preparation: The 2 sets of biological calibrator solutions were prepared as follows:
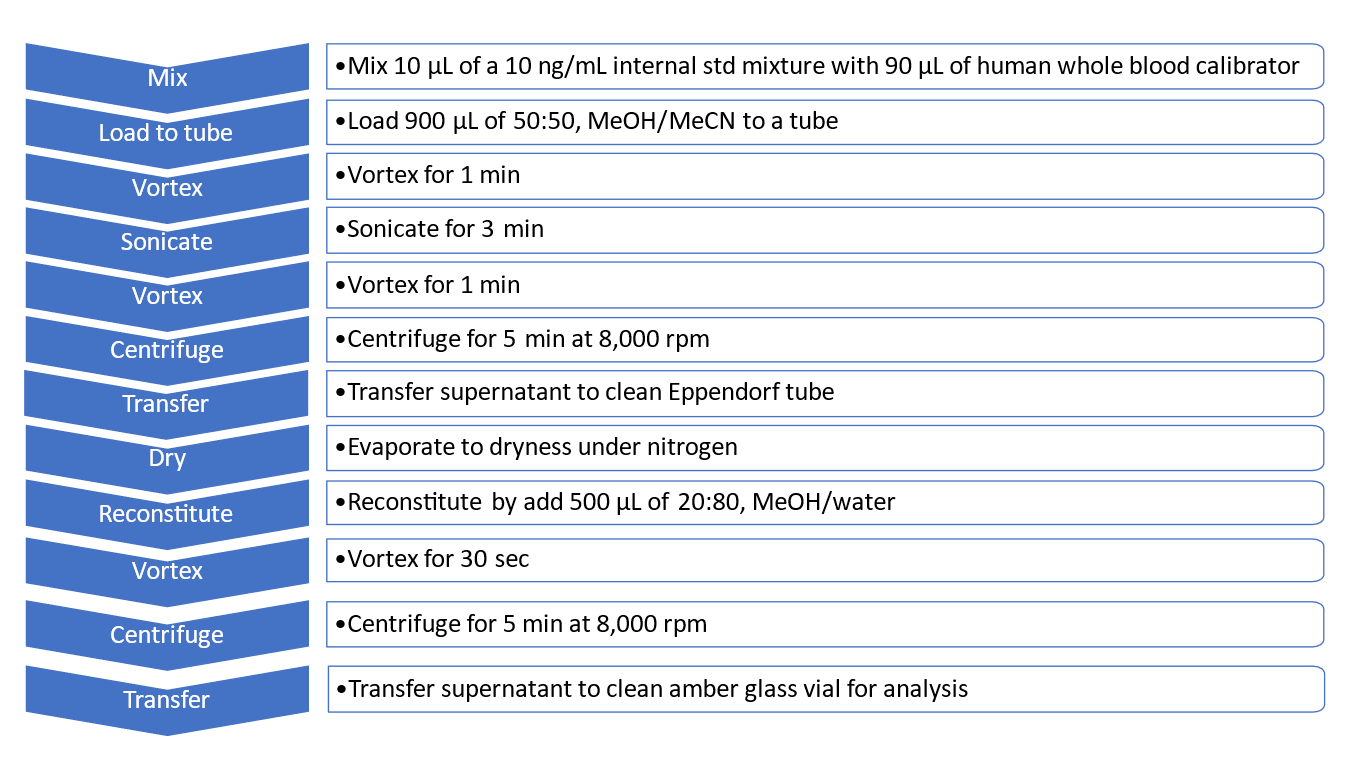
Human whole blood samples: 10 µL of the 10 ng/mL internal standard mixture was added to 90 µL of each of the human whole blood calibrator solutions. Then 900 µL of a 50:50, methanol/acetonitrile solution was added to deproteinize the human whole blood samples. The resulting solution was vortexed for 1 minute and then sonicated for 3 minutes. The solution was then vortexed for 1 minute and centrifuged for 5 minutes at 8000 rpm. The supernatant was transferred to a clean Eppendorf tube and completely dried down under nitrogen gas. The residues were reconstituted with 500 µL of 20:80, methanol/water. The reconstituted solution was mixed for 30 seconds then centrifuged for 5 minutes at 8000 rpm. The supernatant was transferred to a clean amber glass vial for analysis. The protein precipitation procedure for human whole blood samples is summarized in Figure 2.
Figure 2. Protein precipitation procedure for human whole blood samples. A 12-step protein precipitation procedure was used for extracting the 130 NPS from human whole blood samples for analysis with the X500R QTOF system.
Human urine samples: 10 µL of the 10 ng/mL internal standard mixture was added to 90 µL of each of the human urine calibrator solutions. Then 700 µL of water and 200 µL of methanol were added and the resulting solution was vortexed for 30 seconds and centrifuged for 5 minutes at 8000 rpm. The supernatant was transferred to a clean amber glass vial for analysis. The dilute-and-shoot preparation procedure for human urine is summarized in Figure 3.
Figure 3. Dilute-and-shoot preparation procedure for human urine samples. A 5-step dilute and shoot precipitation procedure was used for extracting the 130 NPS from human urine samples for analysis with the X500R QTOF system.
Liquid chromatography: HPLC separation was performed on a Phenomenex Kinetex Phenyl-Hexyl column (50 × 4.6 mm, 2.6 µm, 00B-4495-E0) on an ExionLC AC system using the LC conditions highlighted in the vMethod.2 Mobile phases used were ammonium formate in water and methanol with appropriate additives. The flow rate was 0.7 mL/min. The injection volume was 10 µL and the total LC runtime was 9.5 minutes.
Mass spectrometry: Two non-targeted data acquisition methods were used and compared on the X500R QTOF system. Both data dependent acquisition (DDA) and SWATH data independent acquisition (DIA) generated data that could be analyzed retrospectively. Both experiments started with a TOF MS scan to collect accurate mass precursor ions from 100 to 650 Da. For DDA, a TOF MS/MS full scan ranging from 25 to 650 Da was acquired to ensure all fragments were captured for identification using a maximum of 14 candidate ions. For SWATH DIA, 14 variable Q1 windows ranging from 25 to 650 Da were acquired. Both acquisition methods generated comprehensive and high-quality MS/MS spectra, enabling reliable compound fragmentation to search against spectral library databases to identify analytes. Data acquisition was performed using SCIEX OS software, version 2.0. Samples were injected in triplicate over the course of 3 consecutive days to build a data processing method.
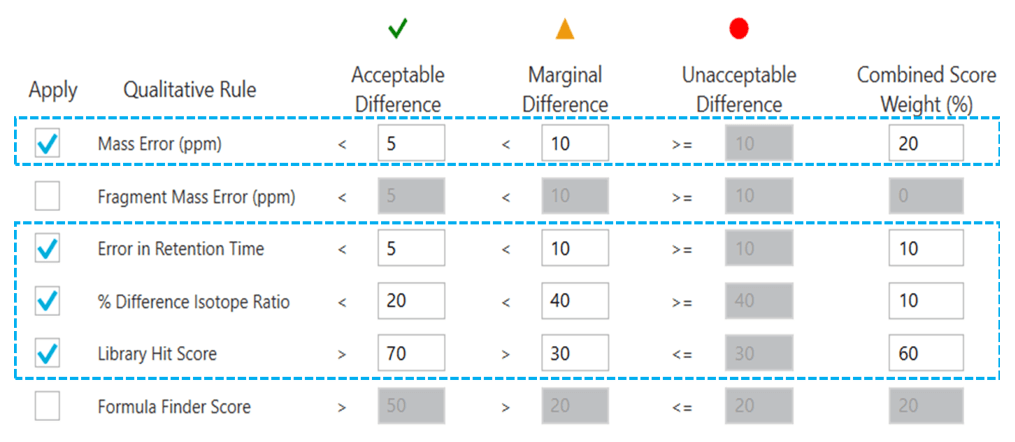
Data analysis: Data processing was performed using SCIEX OS software, version 2.0 for positive analyte identification based on confidence criteria, as previously described.2,3 The 4 main confidence criteria used are outlined in Figure 4 and included mass error (M), retention time (R), isotope ratio difference (I) and library score (L). A new processing method was created in the Analytics workspace of SCIEX OS software. The components tab was populated by entering the name, molecular formula, precursor mass and retention time of the 130 NPS that were determined following the neat standard mixture injection. The components table for the 130 NPS included in this panel is available for download in the Supporting Information. Spectral library database searching was accomplished by matching the high-quality TOF MS/MS spectra acquired from the matrix calibrator samples to those of a custom-built library using the TOF MS/MS spectra generated using the neat standard mixture. Rapid and automated quantitative data analysis was performed using the MQ4 algorithm in the Analytics module to streamline data processing. Peak area values, calibration curves, concentration calculations, assay precision and accuracy statistics were automatically generated in the Analytics module of the software.
Figure 4. Confidence criteria used for data processing in SCIEX OS software. Qualitative rules including mass error (20%), retention time (10%), isotope ratio difference (10%) and library score (60%) used to assess positive analyte identification using the traffic light system.
Optimized LC conditions to separate isomeric species
The separation conditions of the vMethod application for forensic toxicology screening on the X500R QTOF system were used for these experiments. A diluted 10 ng/mL neat standard mixture containing the 130 NPS was used to determine the retention times of the analytes. Figure 1 shows the chromatographic profile of the 130 NPS. Baseline separation was achieved for most of the analytes, except for a few isomeric species that shared the same precursor mass and chemical formula and therefore had similar structures and MS/MS fragmentation patterns. Although the 9.5-minute LC method gradient and conditions enabled baseline separation of most analytes, the introduction of challenging isobaric substances in this panel might prevent chromatographic resolution and thus identification of those species based only on retention time.
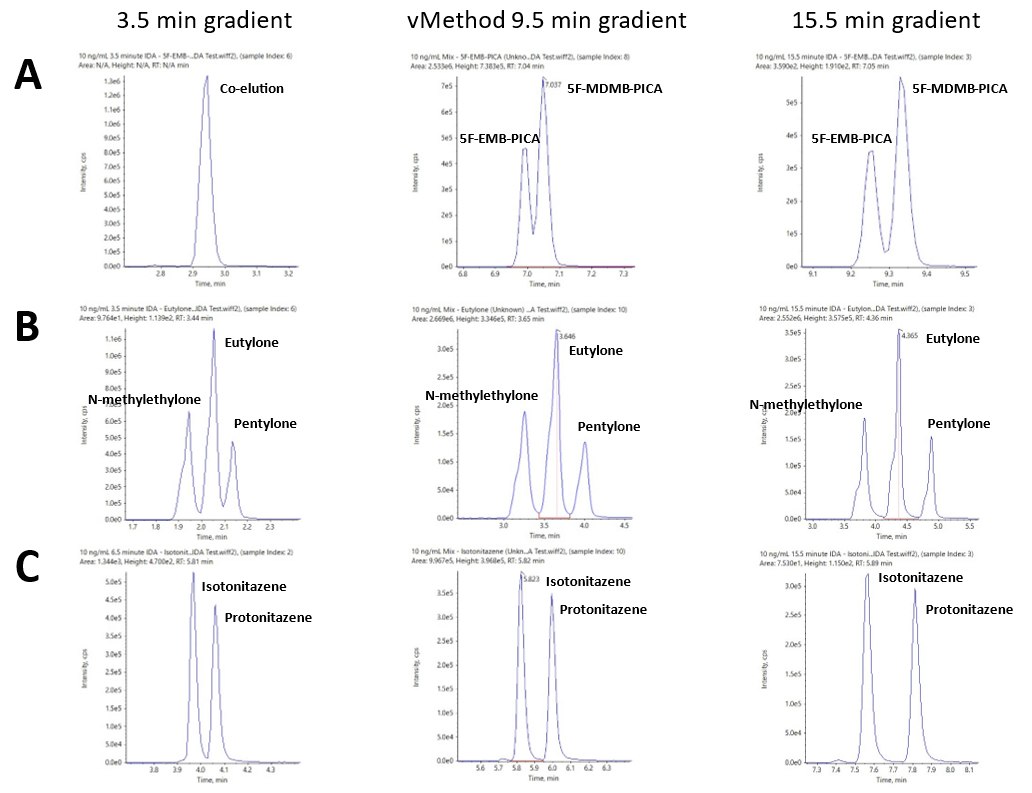
Figure 5 shows the extraction ion chromatogram (XIC) traces for 3 groups of isobaric species separated using LC runtimes with 3.5-, 9.5- (vMethod conditions) or 15.5-minute gradients. Figure 4A shows that the 9.5-minute vMethod condition was unable to achieve baseline separation of 5-MDMB-PICA and 5F-EMB-PICA, 2 isobaric synthetic cannabinoids. The use of the longer, 15.5-minute gradient enabled baseline separation of these 2 isobaric species. The use of a shorter, 3.5-minute gradient resulted in co-elution of these 2 species, demonstrating that distinguishing these 2 isobaric synthetic cannabinoids is not possible by only LC separation with such a short gradient. Figure 4B shows that baseline separation of 3 synthetic cathinone isobaric species, eutylone, N-methylone and pentylone, was achieved using the generic, 9.5-minute vMethod conditions.
However, near-baseline resolution of these isobaric species was achieved using the 3.5-minute gradient (Figure 4B). Full baseline separation of 2 potent novel synthetic opioids, isotonitazene and protonitazene, was achieved using the 3.5-minute gradient (Figure 4C). The results shown in Figure 4 demonstrate that the LC separation conditions of the vMethod provide a good generic method to separate challenging isobaric species. LC conditions such as the runtime and gradient can be modified based on the nature of the analytes screened using this workflow. Good judgement and caution are recommended when making these changes to ensure the method is fit for purpose and tailored based on the screening requirements.
Figure 5. Effect of LC gradient runtime on the separation of isobaric species. XIC traces for A) 5-MDMB-PICA and 5F-EMB-PICA, B) eutylone, N-methylone and pentylone and C) isotonitazene and protonitazene using 3.5-, 9.5- (vMethod conditions) and 15.5-minute LC gradient runtimes. The results show that the LC separation conditions are important for separating challenging isobaric species.
Criteria for confident NPS identification
Although chromatographic separation is key to resolve and distinguish analytes in a mixture, retention time information alone is often not sufficient to confidently identify compounds with similar structures and MS/MS fragmentation patterns, such as isobaric species. One of the benefits of the use of high-resolution mass spectrometry (HRMS) and data independent acquisition, such as SWATH DIA, is that it enables the generation of a comprehensive digital archive of the sample at both the precursor and fragment levels on all detectable components in the sample. The acquisition of accurate mass data enables accurate identification of drugs through a combination of precursor mass accuracy, by incorporation of the chemical formula into criteria for positive identification (TOF MS), and comprehensive, high-quality MS/MS spectra, through spectral library database searching (TOF MS/MS). As a result, acceptance criteria such as mass error, isotope difference/score and library matching score are typically used in addition to retention time error to confidently assess compound identification. Figure 4 shows the confidence criteria used with corresponding performance levels, used as qualitative rules, for positive analyte identification in SCIEX OS software. The integration of these confidence criteria to the Analytics module of SCIEX OS software provides the ability to filter the positively identified compounds using the “traffic lights” system, which provides a visual assessment of the match quality based on the customized weightings assigned for each of the confidence criteria.
Streamlined analyte identification
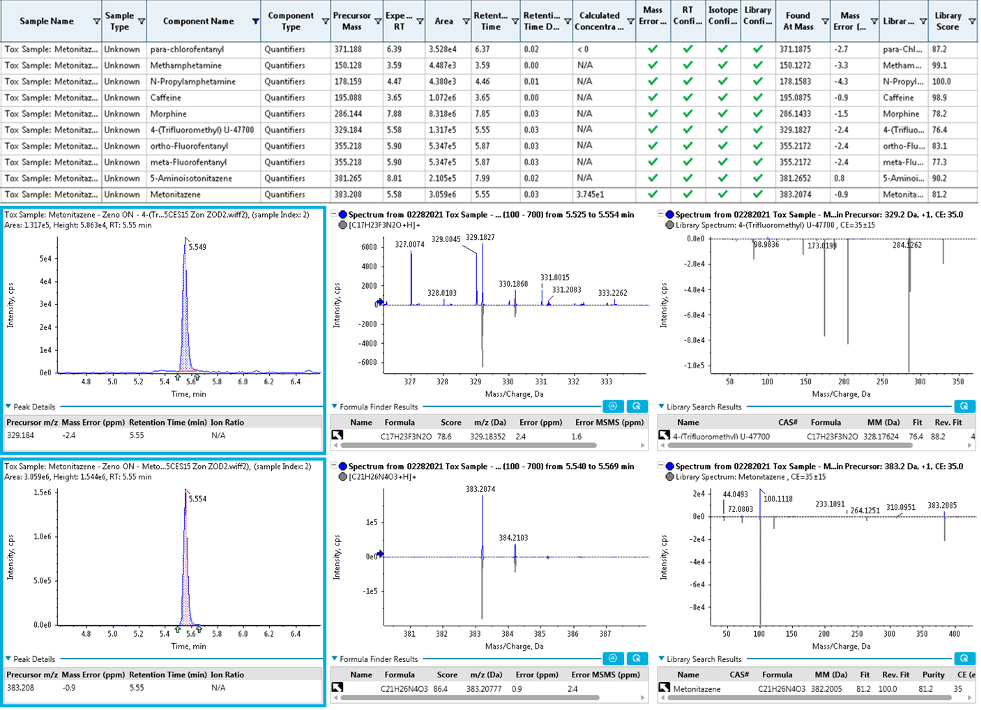
The data analysis component of SCIEX OS software provides an integrated data processing and management platform that allows streamlined data review based on the scoring and reporting criteria set by the user. This step is systematically performed as part of the data review process to ensure correct drug identification while minimizing false positives and/or false negatives. Identification of the analytes was performed by displaying the XIC and TOF MS and MS/MS spectra of the sample with a library search match for each of the NPS included in the screening workflow. Figure 6 (bottom) shows examples of XICs and TOF MS and TOF MS/MS spectra with library matches for 4-Trifluoromethyl-U-47700 and metonitazene, 2 synthetic opioids included in the NPS panel. The retention time error, mass error, isotope ratio difference and MS/MS library score were automatically calculated in SCIEX OS software. Figure 6 (top) shows the parameters and metrics associated with the identification of the analytes. SCIEX OS software provides a simplified interface for streamlined data review based on a robust and reliable scoring system, enabling confident identification of the NPS.
Figure 6. Streamlined and confident NPS identification using SCIEX OS software. (Top) Results table in SCIEX OS software showing the analytes positively identified in an authentic case sample. Mass, library match and library score were assessed using the confidence criteria. (Bottom) XICs, TOF MS and TOF MS/MS spectra collected provided detailed and confident identification of 2 of the positively identified analytes, 4-(trifluoromethyl) U-47700 and metonitazene, 2 synthetic opioids included in the NPS panel.
Improved analyte identification capabilities
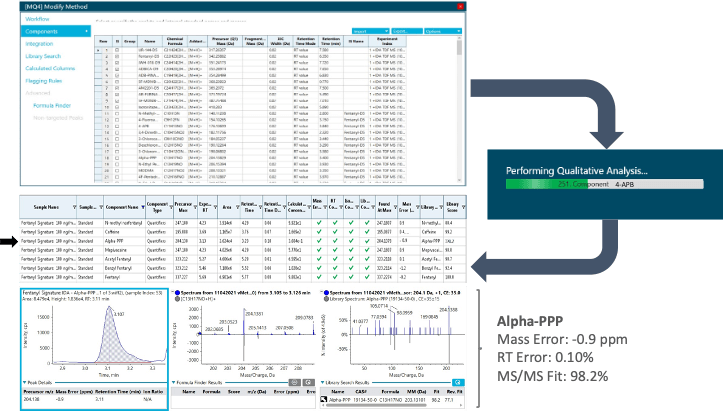
The use of high-resolution mass spectrometry enables collection of untargeted, accurate mass TOF MS scans of precursor ions followed by acquisition of comprehensive, high-quality TOF MS/MS spectra of the precursor ion fragments. As a result, the non-targeted nature of the DDA and SWATH DIA data acquisition methods used in this workflow allows for expanded drug detection capabilities. Identification of these new drugs in previously acquired datasets can be performed retrospectively using the updated list of NPS provided in this technical note, which includes the name, molecular formula and retention time of each compound. This allows datasets to be re-processed when newly identified forensic targets are discovered without the need to re-inject samples. Figure 7 shows the results of the retrospective analysis of a postmortem case sample that was initially analyzed in 2019. The results table generated in SCIEX OS software shows the positive identification of 7 compounds. Retrospective data analysis was performed on the same data using the updated list of NPS presented in this workflow. Figure 7 shows the detection of the same 6 compounds that were originally identified in 2019 with the addition of Alpha-PPP, one of the stimulants included in this panel. The same confidence criteria were used for confident identification of Alpha-PPP in the re-interrogated sample. Figure 7 (bottom) shows the XICs and TOF MS and MS/MS spectra of Alpha-PPP. A precursor mass error of -0.9 ppm, retention time error of 0.10% and MS/MS fit score of 98.2% provided excellent measures for the confident identification of this analyte in the postmortem case sample.
Figure 7. Retrospective analysis performed on a previously acquired dataset using SCIEX OS software. Data acquired using an authentic case sample was reprocessed after modifying the processing method window by adding the 130 NPS included in this panel (top). The stimulant Alpha-PPP was retrospectively identified in the authentic case sample from the SWATH DIA data. A precursor mass error of -0.9 ppm, retention time error of 0.10% and an MS/MS fit score of 98.2% provided excellent measures for the confident identification of Alpha-PPP in the postmortem case sample.
Flexible quantification
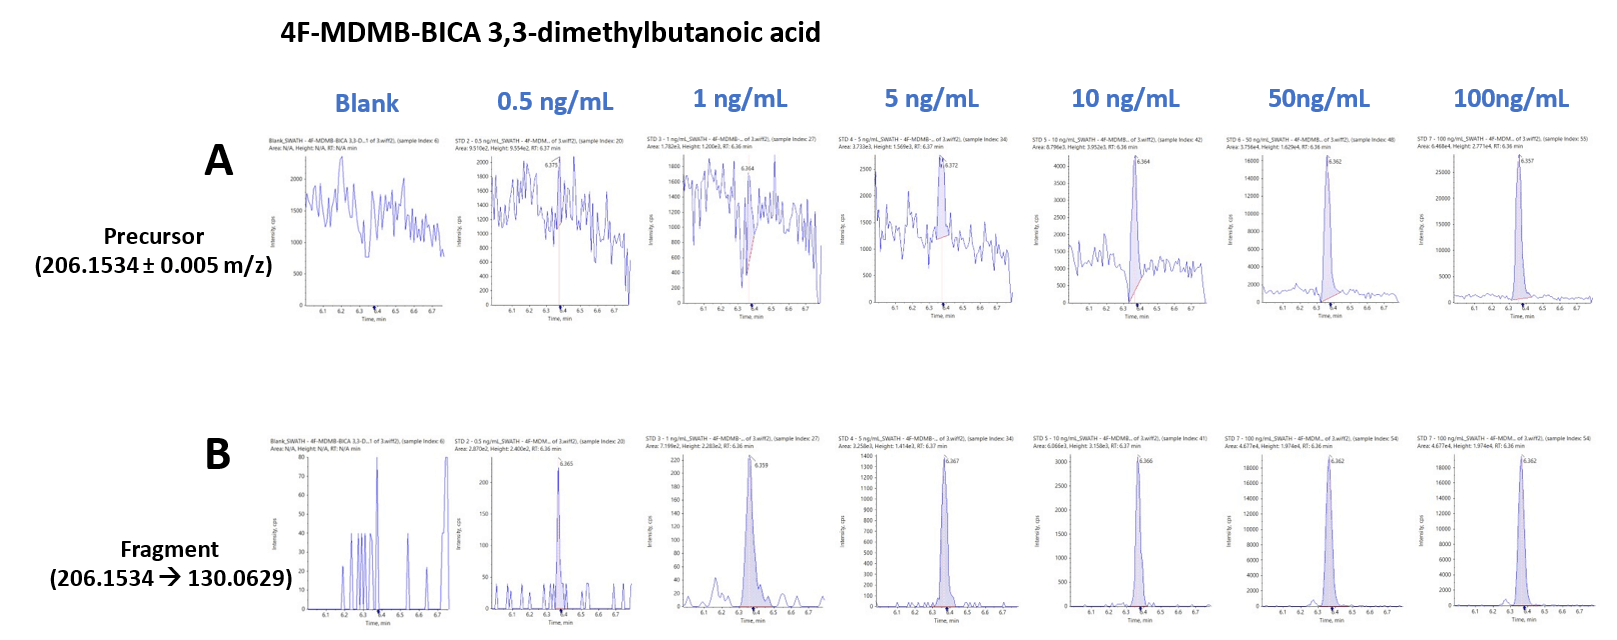
Another advantage of the use of untargeted data acquisition for NPS screening is that it provides flexibility for quantification of the analytes. Since both TOF MS and TOF MS/MS scans are acquired, users can perform quantification using either precursor or fragment ion information. The use of precursor ion information is usually sufficient but the use of fragment ion information is helpful for complex sample matrices. Figure 8 shows representative XICs for 4F-MDMB-BINACA 3,3-dimethylbutanoic acid and its quantification using the precursor ion (206.1534 ±0.005 m/z; Figure 8A) and the fragment ion (206.1534 -->130.0629 m/z; Figure 8B). The series of XICs show the resulting signal for a blank injection (left) and at concentrations ranging from 0.5 to 100 ng/mL. The use of the fragment ion information significantly reduced the background signal. A few other analytes, including most synthetic cannabinoids, benefited from this approach.
The mass errors (less than or equal to 1 ppm), mass spectra library scores (above 97%) and the combined scores (above 96%) provided excellent measures of the confident identification of these two compounds in spiked urine samples.
Figure 8. SWATH DIA enables flexible and reliable quantification using precursor (top) and fragment (bottom) ion information. Quantification of 4F-MDMB-BICA 3,3-dimethylbutanoic acid at concentrations ranging from 0.5 to 100 ng/mL using A) precursor ion information (206.1534 ±0.01 m/z) and B) fragment ion information (206.1534 --> 130.0629 ±0.01 m/z). The use of the fragment ion significantly reduced the background signal.
Robust and precise quantification
The ability to deliver reproducible and accurate results for every injection of every batch is important for a forensic toxicology laboratory to achieve reliable quantification in an NPS screening workflow. The robustness of the vMethod application for forensic toxicology screening on the X500R QTOF system was investigated by analyzing extracted human urine and whole blood samples at concentrations ranging from 0.5 to 100 ng/mL. Detection and integration of peaks from the background were performed automatically within the viewing window using the MQ4 algorithm in the Analytics module of the software to generate peak area and concentration values for each of the 130 NPS included in this workflow. The use of SCIEX OS software enabled efficient and streamlined analysis of replicate injection averages (n=9, 3x for 3 days) which were used to verify the calibration range, linearity and inter- and intra-day precision at 10 ng/mL.
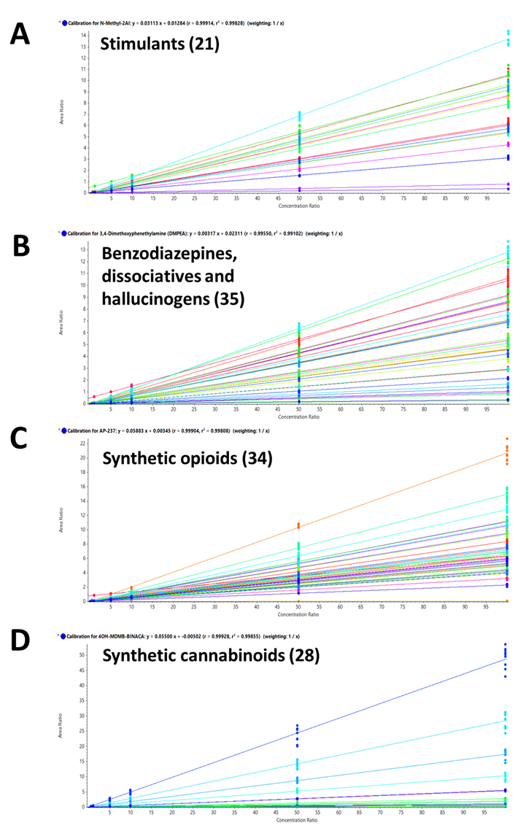
Calibration curves were generated for each of the 130 NPS included in the panel. Figure 9 shows the resulting regression lines for A) 22 stimulants; B) 35 benzodiazepines, dissociatives and hallucinogens; C) 34 synthetic opioids and D) 28 synthetic cannabinoids, including the 2 cannabinoids, delta-8 THC and delta-8 carboxy THC. Each of the calibrator solutions was injected in triplicate on 3 consecutive days to yield 9 total injections. These calibration curves demonstrated excellent correlation of the generated regression curves, with R2 values >0.99 for all NPS targeted in the panel, regardless of the acquisition method used.
The performance of the SWATH DIA and DDA workflows was compared for each of the 2 sets of biological samples. The series of calibrator solutions was injected in triplicate over the course of 3 consecutive days to accurately measure the precision of measurements. Overall, the assay showed great reproducibility over the course of 3 consecutive days with intra- and inter-day precision %CV values below 10% for all the calibrator solutions. These results demonstrate the quantitative robustness of the 2 untargeted acquisition methods in both human urine and whole blood samples.
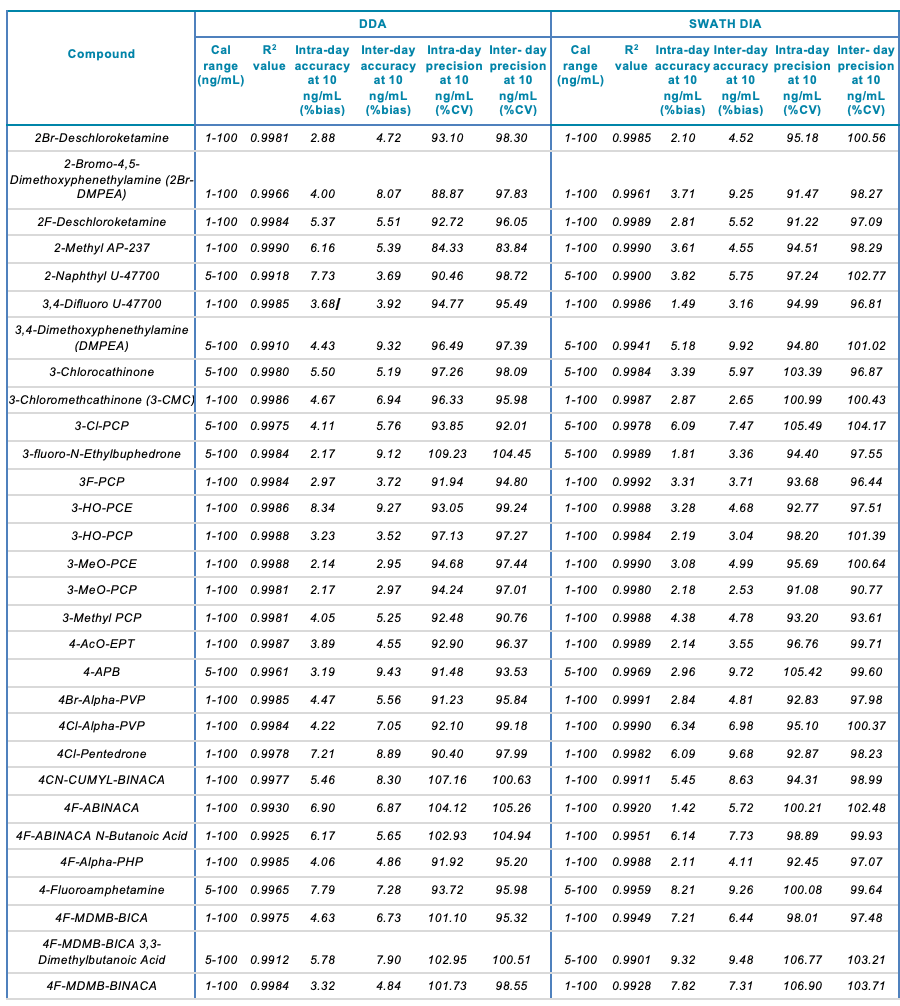
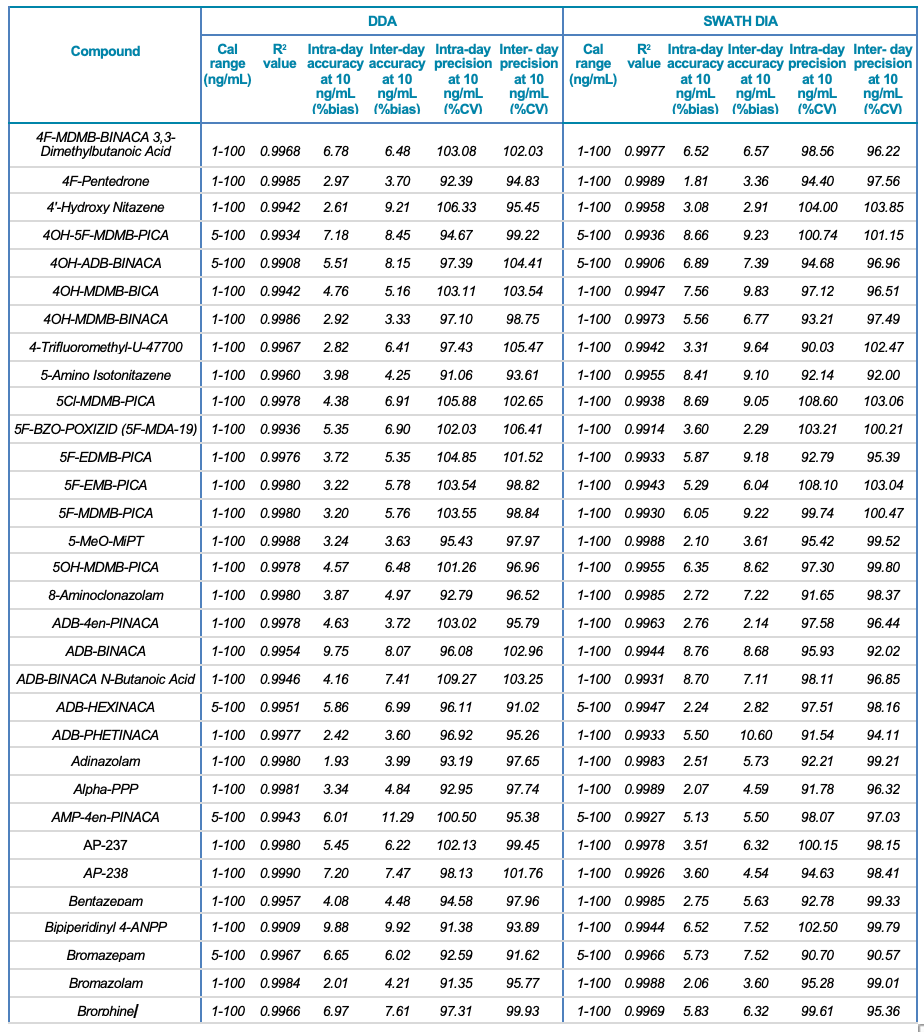
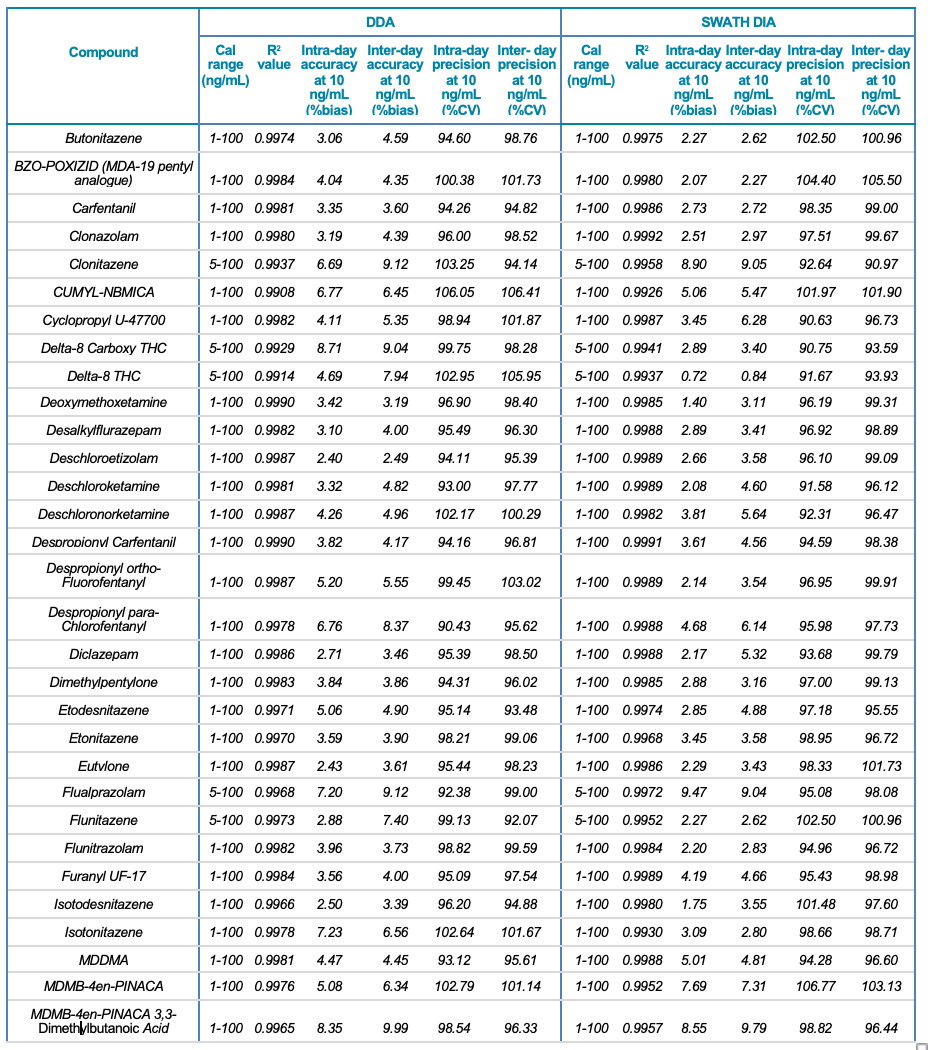
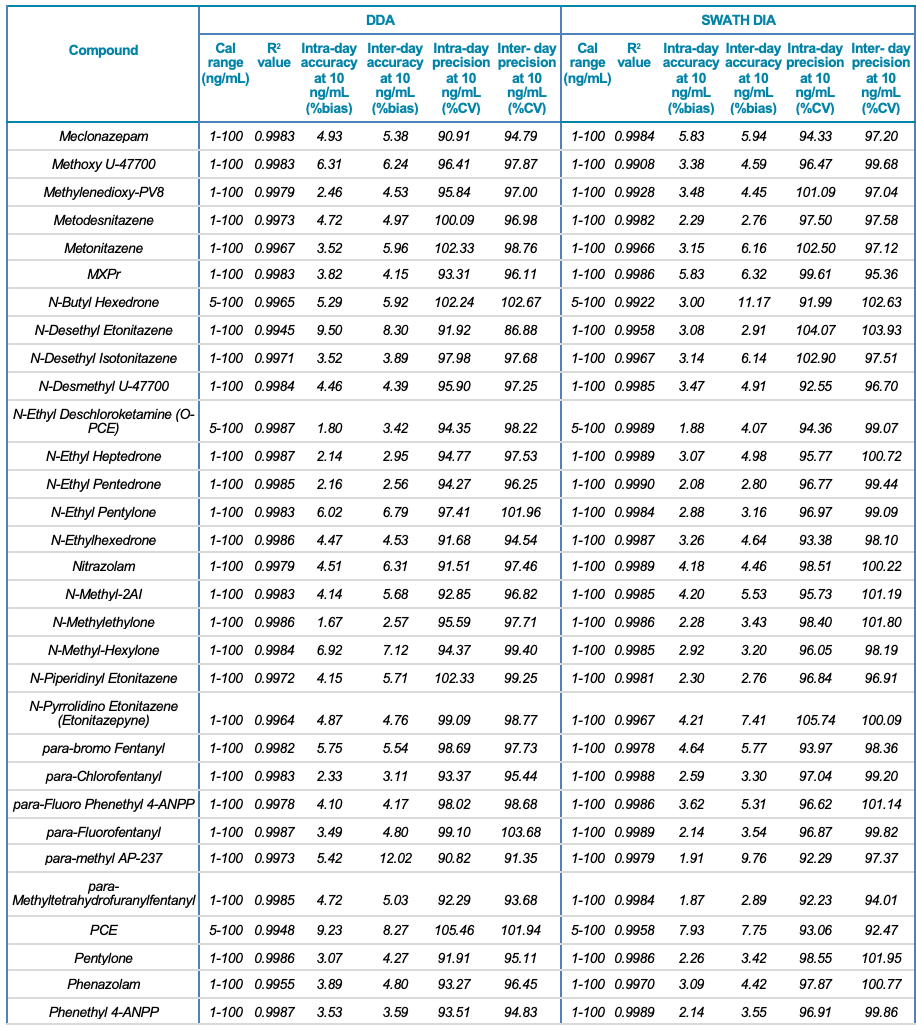
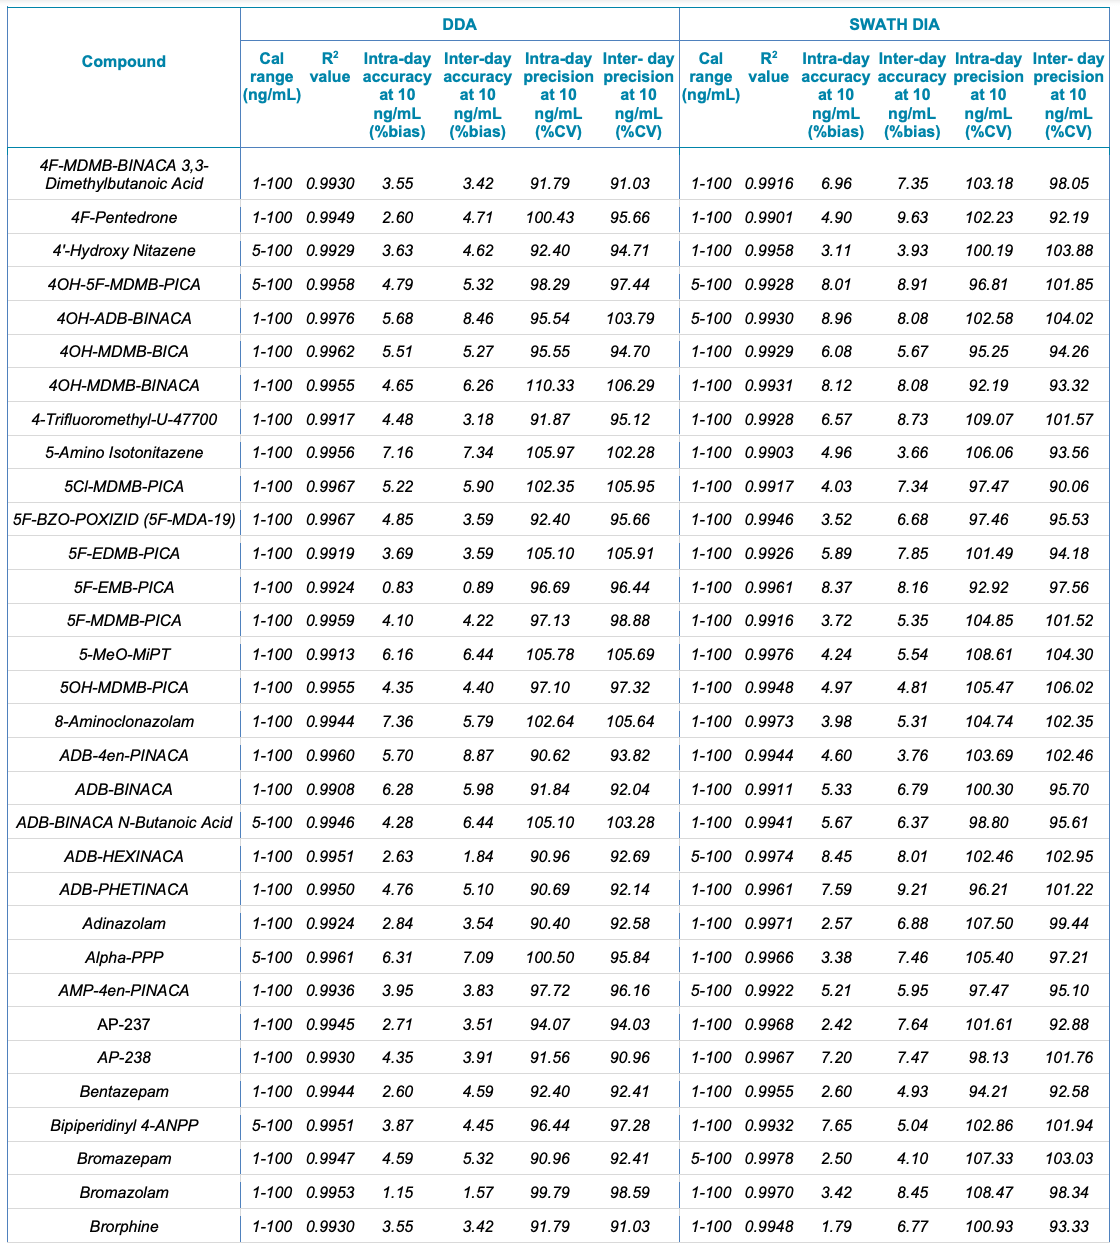
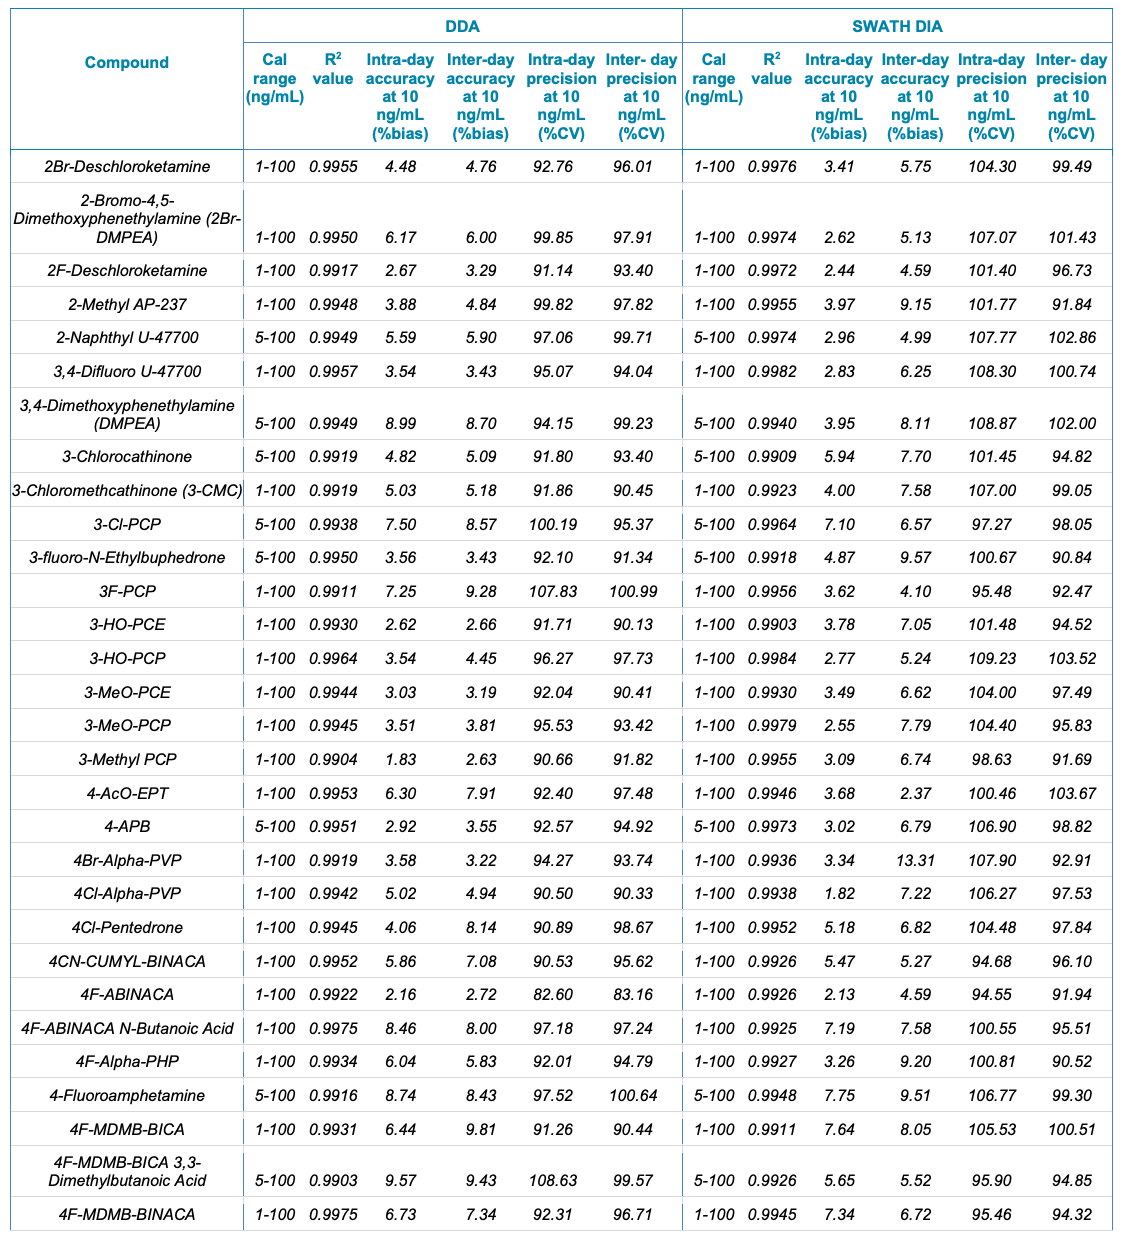
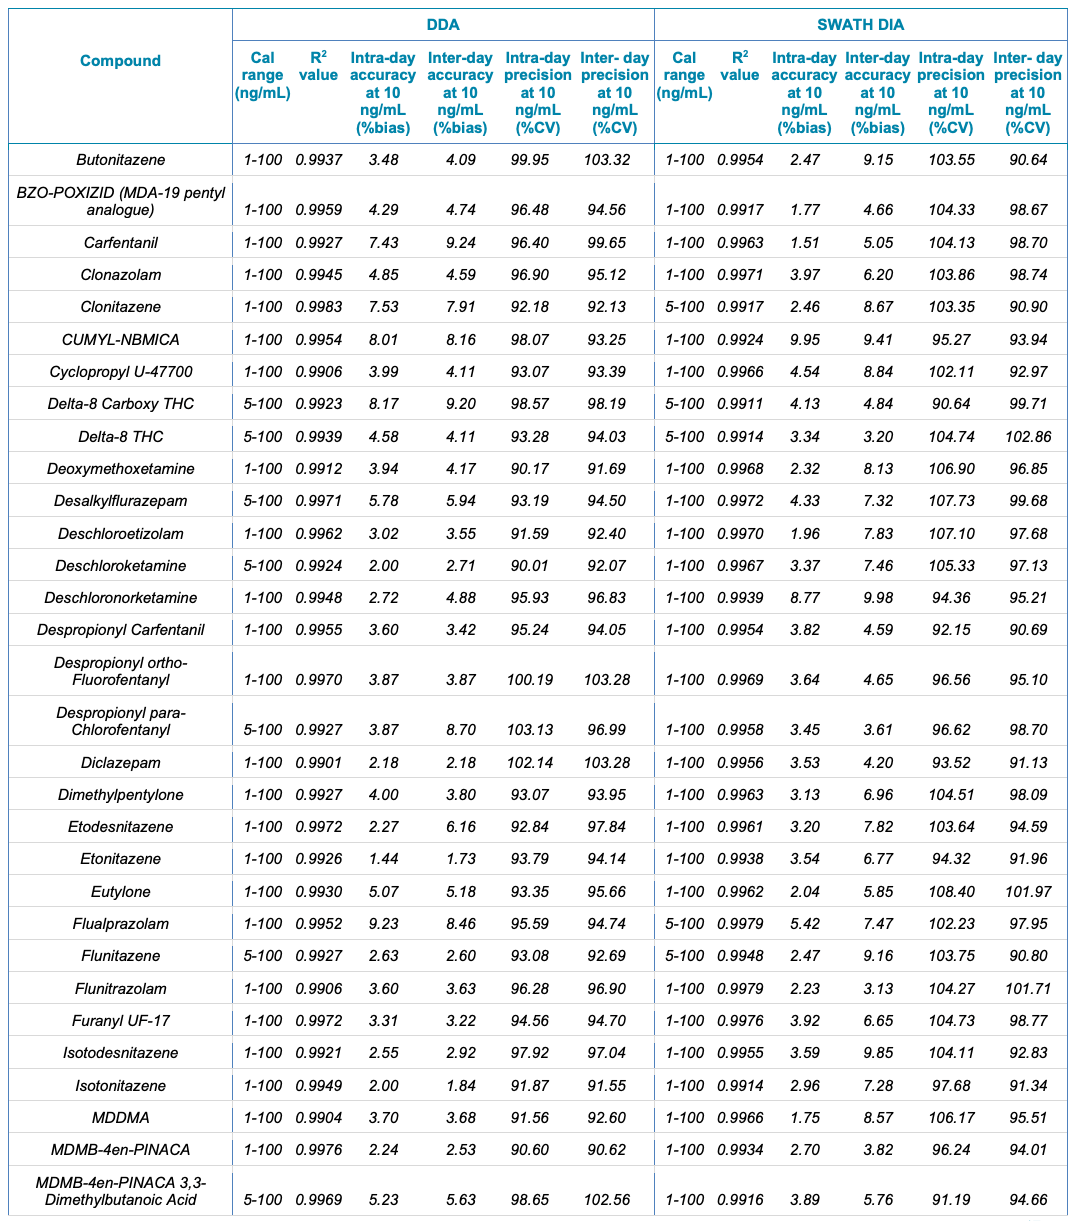
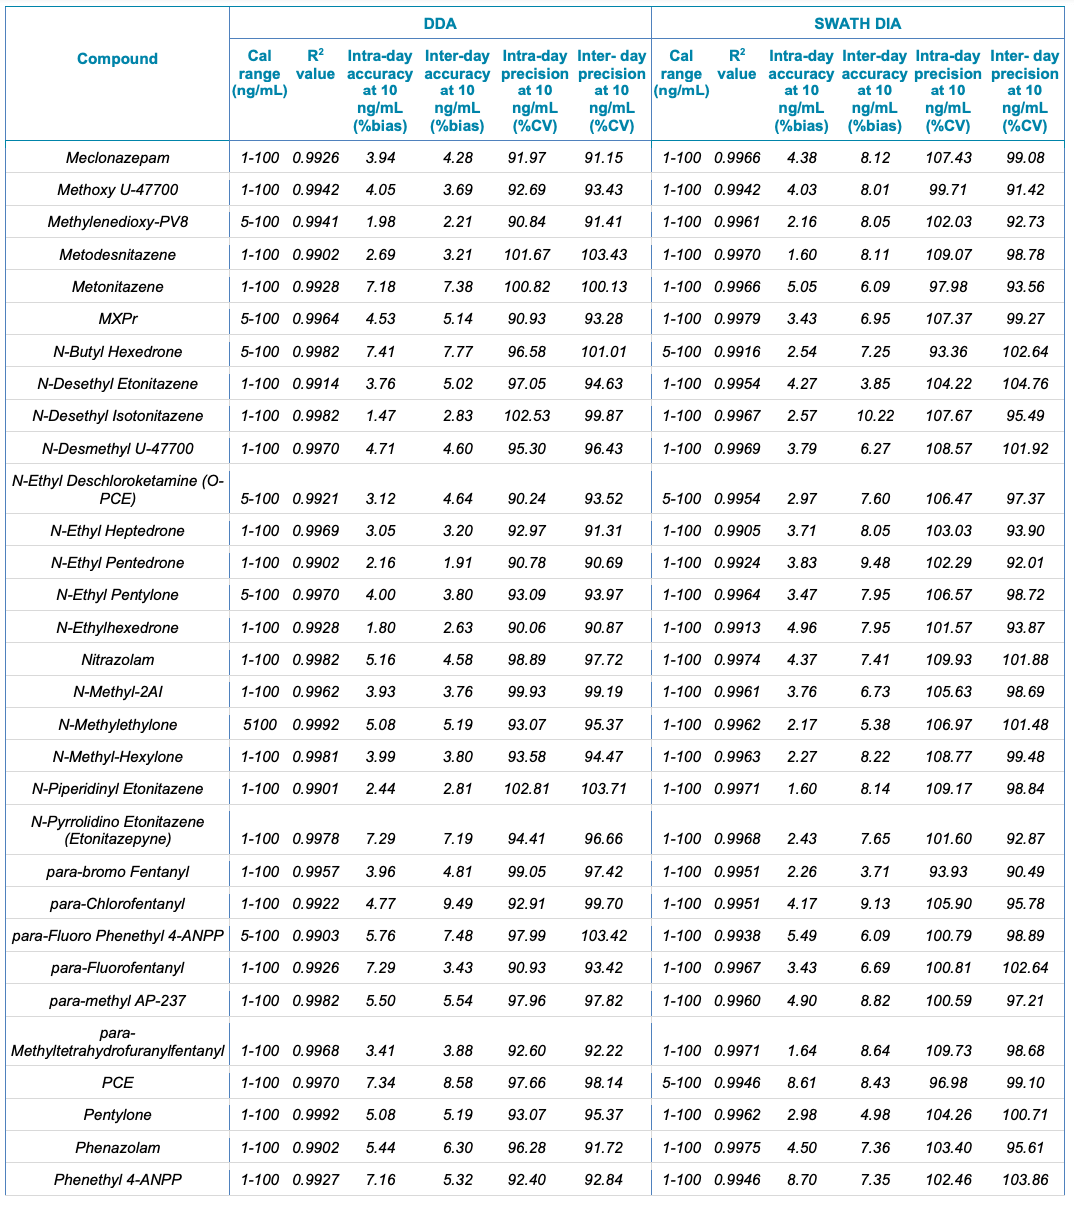
Tables 1 and 2 summarize the statistical results obtained for the 130 NPS and includes the calibration range, linear correlation coefficient (R2) and the intra- and inter-day precision at 10 ng/mL for both the SWATH DIA and DDA workflows in human urine and whole blood, respectively. In addition to providing accurate identification of the NPS using TOF MS/MS spectral library matching, the vMethod application for forensic toxicology screening on the X500R QTOF system provided robust and accurate quantification of the drugs in the panel without any compromise to data quality.
Figure 9. Excellent linearity for the 130 NPS included in the panel. Calibration curves resulting from the calibration series for A) 22 stimulants; B) 35 benzodiazepines, dissociatives and hallucinogens; C) 34 synthetic opioids and D) 28 synthetic cannabinoids. Excellent linear response and sensitivity were observed with R2 values greater than 0.99 for all the molecules included in this panel.
DDA vs SWATH DIA: Performance of the data acquisition methods
DDA and SWATH DIA are 2 untargeted data acquisition methods that provide TOF MS and TOF MS/MS information in the form of high-resolution precursor mass and comprehensive MS/MS spectral fragment information that can be used for identification, confirmation and/or library matching. Both data acquisition methods start with a TOF MS experiment covering a mass range determined by the user. However, DDA differs from SWATH DIA in the way the MS/MS information is triggered and acquired. In SWATH DIA, MS/MS information is collected for all detectable compounds in the sample, whereas DDA relies on the user to define the maximum number of candidate ions and therefore the maximum number of dependent TOF MS/MS scans triggered from the TOF MS survey scan in each data cycle. As a result, the MS/MS information for the least abundant species present in the biological matrix might be missed in DDA data, as the more intense ions are prioritized within each data cycle.
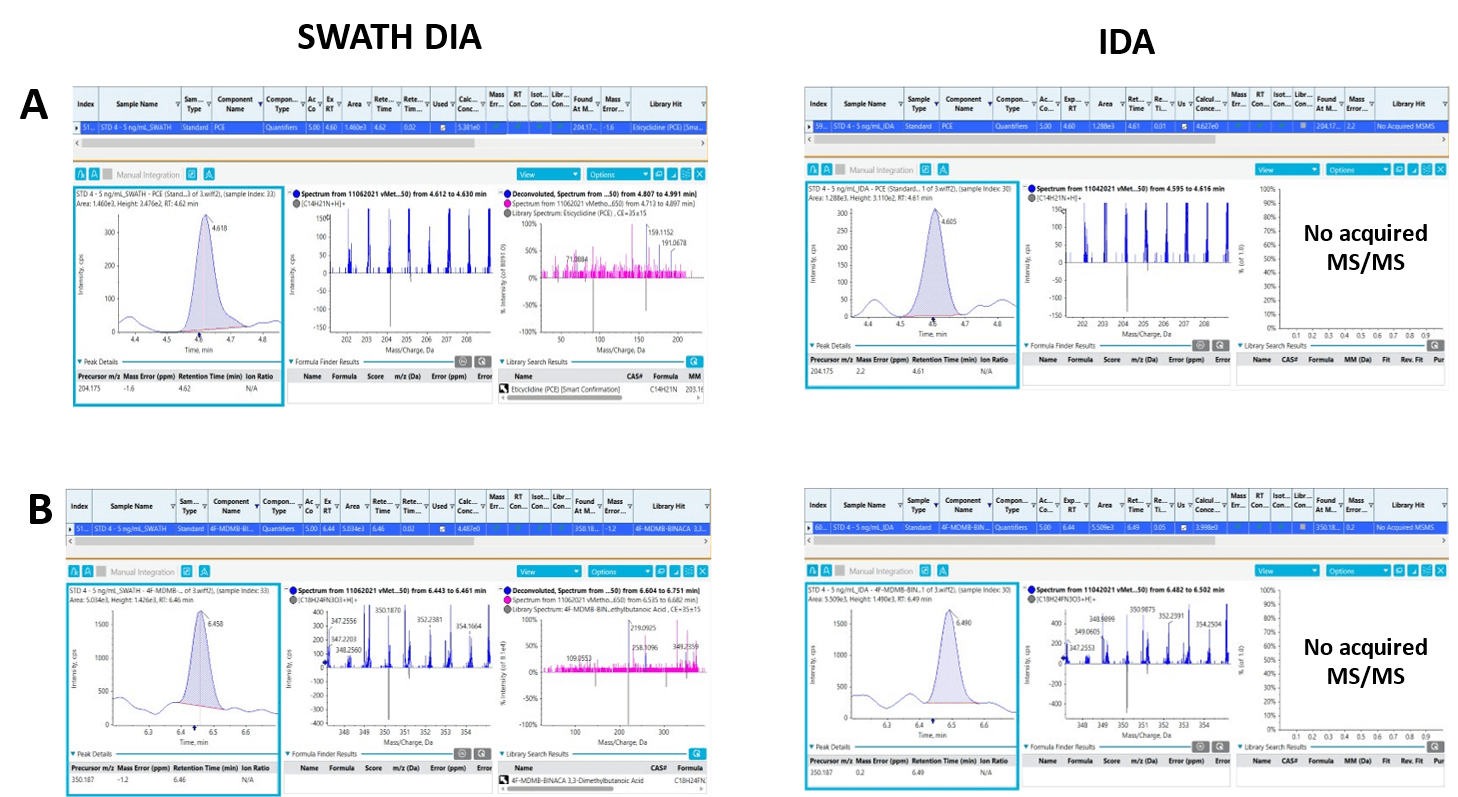
MS/MS spectral library matching is the most integral part of the screening workflow, as an MS/MS spectrum provides the fingerprint-like structural details of a compound that are used to perform MS/MS spectral library matching for confident compound identification. The ability to acquire TOF MS/MS information on low-abundant species present in the complex biological samples analyzed was assessed by comparing the TOF MS/MS positivity rates for the 2 data acquisition methods used in this workflow. Figure 10 shows 2 instances in which TOF MS/MS spectra were acquired with SWATH DIA and DDA, but only SWATH DIA data were able to confirm the presence of low concentration drugs. Figures 10A and 10B show the detection and accurate identification of PCE and 4F-MDMB-BINACA 3,3-dimethylbutanoic acid, respectively, using SWATH DIA (left) and DDA (right) at a concentration of 5 ng/mL. The use of SWATH DIA generated TOF MS/MS spectra that passed the library match criteria for accurate identification of the NPS. However, the MS/MS information was not triggered at the same concentration level when DDA was used as the acquisition method because the most abundant ions in each data cycle were prioritized to trigger the TOF MS/MS experiments, causing the low-abundant species present not to be detected. As a result, some NPS included in this panel did not meet all the confidence criteria at the lower calibrator levels. This is primarily attributed to unacquired MS/MS spectra or poor MS/MS spectral library matching.
Figure 10. Comparison between SWATH DIA and DDA for TOF MS/MS spectral acquisition. XICs, TOF MS and TOF MS/MS spectra acquired using SWATH DIA (left) and DDA (right) for A) PCE and B) 4F-MDMB-BINACA 3,3-dimethylbutanoic acid. The comparisons demonstrate that no TOF MS/MS spectra were acquired when using DDA at the same concentration levels due to the acquisition method prioritizing the most abundant ions in each data cycle to trigger the TOF MS/MS experiments and missing the low-abundant species present in the biological samples. SWATH DIA, however, generated TOF MS/MS spectra with high (>90%) MS/MS library scores at the same concentration levels.
In terms of overall performance, however, DDA and SWATH DIA yielded comparable results. The statistical results summarized in Tables 1 and 2 show that the 2 acquisition methods demonstrated excellent performance in terms calibration range, linearity and inter and intra-day assay precision and accuracy. For both acquisition methods, inter-and intra-day concentration accuracies were more than 90% and inter-and intra-day precisions (% bias) were below 10% at the 10 ng/mL calibration level.
Last, it should be noted that SWATH DIA enables users to select fixed or variable Q1 isolation windows for the TOF MS/MS experiment. This feature enables isolation of the compounds with similar mass, such as isobaric species, into different SWATH DIA windows to minimize the amount of convolution, or multiple precursor ions generating common fragment ions at the same time, in each TOF MS/MS experiment. The results demonstrate that SWATH DIA generates more analyte-specific MS/MS information, significantly improving MS/MS library matching and hence providing more confidence in analyte identification. This can be leveraged to differentiate structurally related compounds and generate a more specific digital record of the sample analyzed, which is an advantage of SWATH DIA over DDA that is highly valuable for retrospective data analysis.
Table 1. Statistical results for the 130 NPS extracted from human urine samples using DDA and SWATH DIA. The table includes the name of the compound, calibration range (ng/mL), linear correlation (R2 value), and the inter- and intra-day accuracy (%bias) and precision (%CV) for each of the 2 acquisition methods investigated.
Table 1. Statistical results for the 130 NPS extracted from human urine samples using DDA and SWATH DIA. Continued
Table 1. Statistical results for the 130 NPS extracted from human urine samples using DDA and SWATH DIA. Continued
Table 1. Statistical results for the 130 NPS extracted from human urine samples using DDA and SWATH DIA. Continued
Table 1. Statistical results for the 130 NPS extracted from human urine samples using DDA and SWATH DIA. Continued
Table 2. Statistical results for the 130 NPS extracted from human whole blood samples using DDA and SWATH DIA. The table includes the name of the compound, calibration range (ng/mL), linear correlation (R2 value) and the inter- and intra-day accuracy (%bias) and precision (%CV) for each of the 2 acquisition methods investigated.
Table 2. Statistical results for the 130 NPS extracted from human whole blood samples using DDA and SWATH DIA. Continued
Table 2. Statistical results for the 130 NPS extracted from human whole blood samples using DDA and SWATH DIA. Continued
Table 2. Statistical results for the 130 NPS extracted from human whole blood samples using DDA and SWATH DIA. Continued
Table 2. Statistical results for the 130 NPS extracted from human whole blood samples using DDA and SWATH DIA. Continued
Conclusions
The workflow highlighted in the Forensic vMethod was used for the analysis of 130 NPS extracted from human urine and blood samples. The use of the X500R QTOF system enabled comprehensive characterization of each of the 130 NPS using 2 non-targeted acquisition methods, DDA and SWATH DIA. This workflow enabled the generation of fragment-rich TOF MS/MS spectra that allowed accurate compound identification using confidence criteria. Parameters such as calibration range, linear correlation coefficient (R2) and intra- and inter-day precision at 10 ng/mL in human urine and whole blood were determined. The results demonstrate that the DDA and SWATH DIA data acquisition methods yielded comparable performance.
The use of SCIEX OS software provided a simplified interface for streamlined data review based on a robust and reliable scoring system. This integrated software platform provides the ability to simultaneously perform compound quantification and library matching within the same workspace. Compound identification was confirmed using MS/MS spectral library matching by leveraging the fragment-rich TOF MS/MS spectra generated.
The results also showcase that this workflow can be used to create a digital archive of the NPS present in the biological samples at the time of sample collection. The flexibility of the processing method provides the ability to screen against a list of targeted compounds and can be quickly adjusted for unknown compound identification using untargeted data processing. Previously acquired datasets can be retrospectively analyzed to look for the presence of newly identified NPS without having to re-inject samples. Overall, the information presented here provides the ability to screen for more than 900 compounds in complex biological specimens a single injection method.
References
- vMethod Application - Single-Injection Screening of 664 Forensic Toxicology Compounds on a SCIEX X500R QTOF System.
- Single-Injection Screening of 664 Forensic Toxicology Compounds on a SCIEX X500R QTOF System. SCIEX technical note, RUO-MKT-08-6395-A.
- Intelligently designed SWATH Acquisition for novel psychoactive substances (NPS) detection in whole blood. SCIEX technical note, RUO-MKT-02-9780-A.
 Click to enlarge
 Click to enlarge
 Click to enlarge
 Click to enlarge
 Click to enlarge
 Click to enlarge
 Click to enlarge
 Click to enlarge
 Click to enlarge
 Click to enlarge
 Click to enlarge
 Click to enlarge
 Click to enlarge
 Click to enlarge
 Click to enlarge
 Click to enlarge
 Click to enlarge
 Click to enlarge
 Click to enlarge
 Click to enlarge