Quantitative analysis of fentanyl and analogues in human whole blood
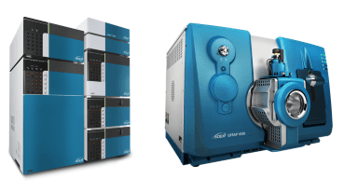
Using the SCIEX QTRAP® 4500 LC-MS/MS System
Casey Burrows1, Alex J. Krotulski2, Diana Tran1, Xiang He1, Oscar G. Cabrices3, Alexandre Wang1, Holly McCall1, and Xiaohong Chen1
1SCIEX, USA; 2Center for Forensic Science Research and Education at the Fredric Rieders Family Foundation, Willow Grove, USA; 3SCIEX, Canada
Abstract
QTRAP 4500 System with the ExionLC AC System enabled the LC separation of 29 fentanyl, its analogues, and metabolites, allowing quantitation at low concentrations in complex matrices such as human whole blood (matrix at 0.1 ng/mL). Method leverages the Scheduled MRM algorithm in Analyst Software 1.7, showed ~4 orders dynamic range.
Introduction
Fentanyl analogues and their metabolites are a rising concern as thousands die from opioid overdose across the country. Some of these synthetic drugs have very high potency and thus only require a small amount for an accidental overdose. In addition, these high potency drugs pose a danger to public health and public safety personnel due to the possibility of skin absorption or inhalation of the drug. In order to properly identify these fentanyl analogues in biological matrices, forensic laboratories require sensitive MS systems to accurately quantitate at low concentrations, and highly specific chromatographic methods in order to separate and properly identify isomers.
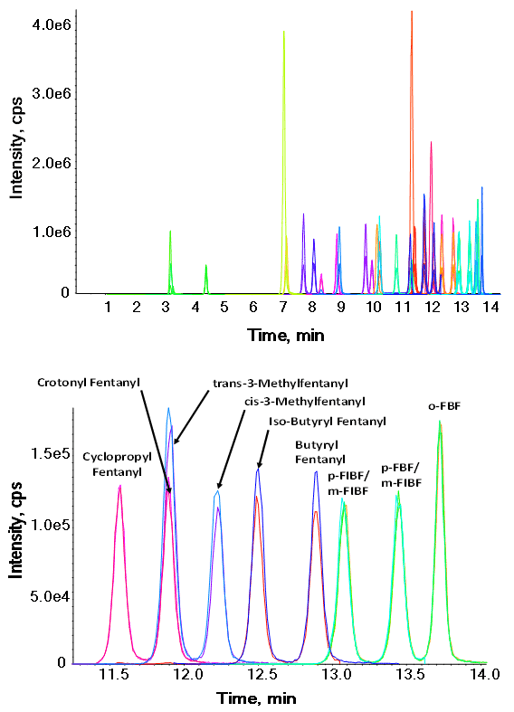
Here, a confirmatory method for fentanyl and its analogues in human blood has been developed. Due to the inclusion of isomers that are challenging to monitor based on similar fragmentation patterns, the separation of these isomers within the panel was key in method development, in order to accurately identify all fentanyl analogues. The main challenge was separation of these isomers chromatographically while maintaining desirable peak shape and reasonable LC run time. Multiple analytical columns and mobile phase combinations were tested until the desired separation was achieved (Figure 1).
Figure 1: Chromatographic profile of the fentanyl panel by LC-MS Analysis. Top panel shows the elution of 34 compounds in a 17-minute runtime. Bottom panel highlights the baseline separation achieved on 9 isomers from 11.3 to 14.0 minutes.
Key features of fentanyl method
- Sample preparation involved a protein crash with acetonitrile, centrifugation followed by a dry down, and reconstitution with mobile phase.
- Baseline separation of all isomers was achieved using the ExionLC™ AC HPLC System for a total runtime of 17 minutes (Figure 1).
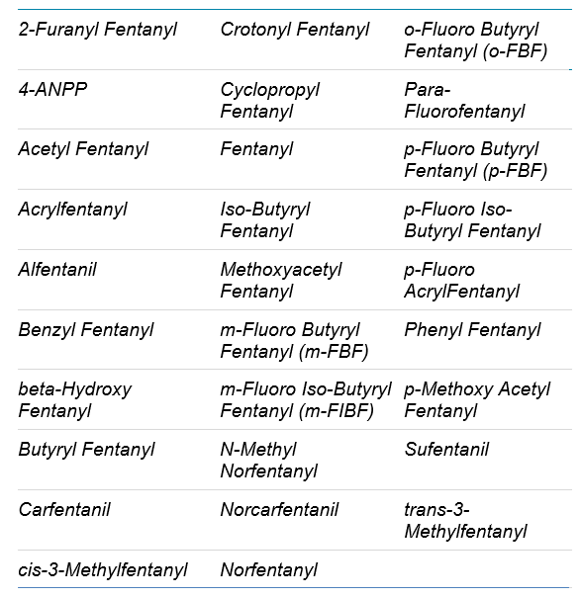
- Fentanyl panel consisted of 29 analytes and 5 internal standards, with a total of 58 MRM transitions.
- Analytes were monitored in positive ionization mode using the QTRAP® 4500 LC-MS/MS System. The sensitivity of the QTRAP 4500 System allowed for picogram (pg) detection limits of these drugs in a complex biological matrix while maintaining linearity and precision for all compounds across the calibration range.
Methods
Sample preparation: A calibration curve was prepared in methanol and spiked into human whole blood to give desired concentrations ranging from 0.1 ng/ml to 100 ng/ml in order to evaluate the dynamic range.
- 40 µL of corresponding methanolic standard was spiked into 360µL of human whole blood. 20 µL of internal standard spiking solution was added, along with 1.14 mL of cold acetonitrile.
- Samples were vortexed vigorously and centrifuged.
- 500 µL of supernatant was transferred, dried down and reconstituted with 125µL diluent solution (mobile phase).
- Subsequent sample was centrifuged, and supernatant was transferred to LC vial for analysis.
Internal standards: Carfentanil-D5, Cyclopropyl Fentanyl-D5, Fentanyl-D5, Methoxyacetyl Fentanyl-D5, and Norfentanyl-D5 were used as internal standards (Cerilliant). All five were combined and diluted in methanol to a concentration of 1000 ng/mL.
Liquid chromatography: HPLC separation was achieved using a Phenomenex C18 column at 30ºC on the SCIEX ExionLC™ AC System. Mobile phase consisted of water, methanol, acetonitrile and modifiers. The LC flow rate was 0.3 mL/min and the total run time was 17 min. The injection volume was 5 µL.
Mass spectrometry: Data was collected using positive electrospray ionization on the QTRAP® 4500 System with Analyst 1.7 Software. Scheduled MRM™ Algorithm was used to collect the appropriate amount of data points for quantifiable data.
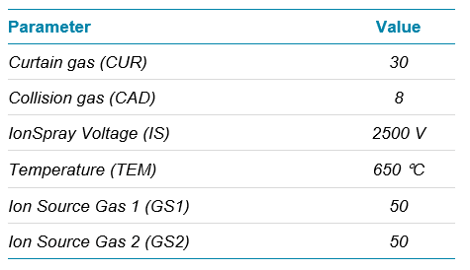
Source parameters are provided in Table 1. The compound-dependent voltages of Declustering Potential (DP), Collision Energy (CE) and Collision Cell Exit Potential (CXP) were optimized for each transition and can be found in the supplementary information.1
Table 1. Source conditions.
Table 2. List of the 29 target compounds analyzed.
Separation of isomers
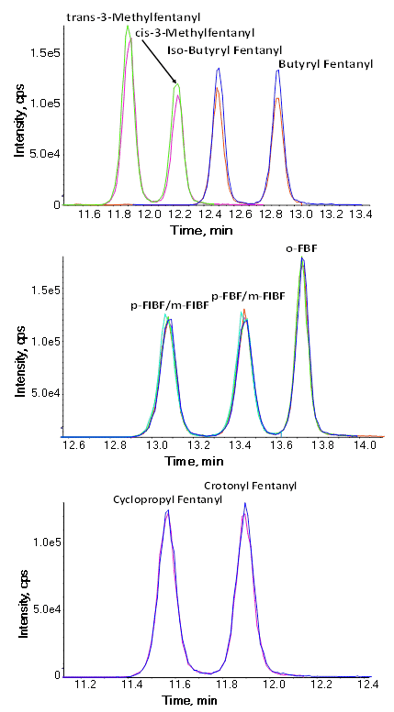
Nine fentanyl analogues (trans-3-MethylFentanyl, cis-3-Methylfentanyl, Iso-Butyryl Fentanyl, Butyryl Fentanyl, p-FIBF/m-FIBF, p-FBF/m-FBF, o-FBF, Cyclopropyl Fentanyl, Crotonyl Fentanyl) were isomeric with other analogues on panel and thus have no unique fragments that could be used for detection. Therefore, chromatographic separation of these analogues from their isomers is critical for confident identification and quantitation and therefore was the focus of this study (Figure 2).
Optimal chromatographic separation was accomplished by using a Phenomenex C18 column which allowed for better retention and selectivity of the more polar analytes throughout the gradient. The column in conjunction with an optimized mobile phase composition produced the separation that was needed to correctly distinguish all isomers (excluding p-FBF/m-FBF and p-FIBF/m-FIBF). This chromatographic separation was optimized for this MRM assay but can also be used on the SCIEX X500R QTOF System, for additional screening or confirmation techniques.
Analogues p-FBF and m-FBF, as well as p-FIBF and m-FIBF, were unable to be separated chromatographically so they were combined to be analyzed together as p-FBF/m-FBF and p-FIBF/m-FIBF. This is often the case with chemically similar positional isomers, as there is a trade-off between separation of ortho-, meta-, and para- species and desirable analysis time. For purposes of this study, it was determined that identification as a set paired analogues was the best strategy.
Figure 2: Examples of separation of specific fentanyl isomers. (Top) Separation of the isomers trans-3-MethylFentanyl, cis-3-Methylfentanyl, Iso-Butyryl Fentanyl, Butyryl Fentanyl from 11.3 to 12.1 minutes. (Middle) Separation of the isomers p-FIBF/m-FIBF, p-FBF/m-FBF, o-FBF from 12.8 to 14.0 minutes. (Bottom) Separation of the isomers Cyclopropyl Fentanyl, Crotonyl Fentanyl from 11.3 to 12.1 minutes.
Data Processing
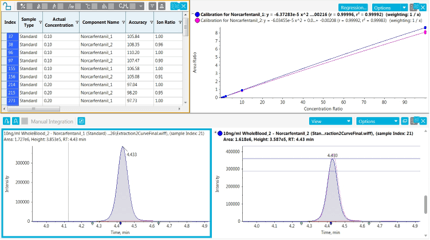
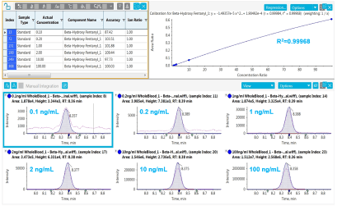
A processing method for the 29 analytes and 5 internal standards was used to review the time-scheduled MRM data in SCIEX OS™ Software. Utilizing the MQ4 algorithm in Analytics, detection and integration of the peaks from the background was easily accomplished. The MQ4 algorithm provided selection of the correct peak within the viewing window, especially in the case of the isomers where more than one peak were present. This ease of use helped in analyzing replicate injections (n=3) which were used to verify the consistency of ion ratios and to confirm the accuracy of concentration values within ± 20%, as shown in Figure 3 and 4.
With the whole blood samples being diluted by a factor of 10 and a low injection volume of 5 µL, all analytes were successfully able to be detected in matrix at 0.1 ng/mL. The least sensitive analyte was norfentanyl with a S/N ratio of 51.8 for the qualifier transition.
Figure 3: Data processing of norcarfentanil using SCIEX OS Software. (Top) Results table with calibration curve from 0.1 ng/mL to 100 ng/mL. (Bottom) First and second transition with ion ratio overlay.
Figure 4: Data processing of beta-hydroxy fentanyl. (Top) Results table with calibration curve from 0.1 ng/mL to 100 ng/mL (Bottom) First and second transition with ion ratio overlay.
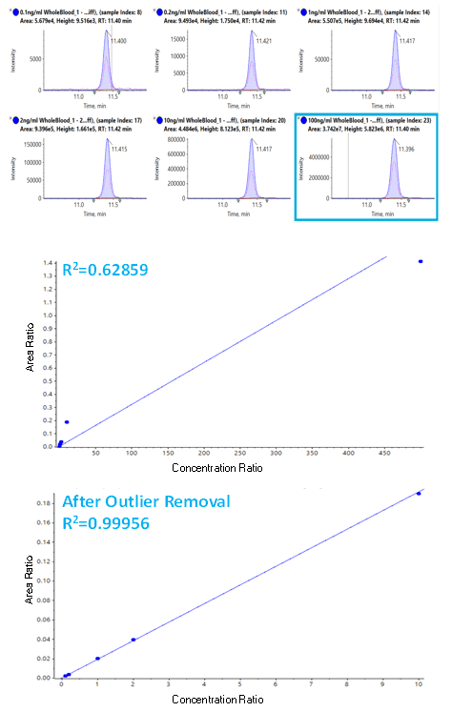
A new feature in the Analytics section of SCIEX OS Software 1.4 is automatic outlier removal. This new feature will remove outliers based on criteria set by the user. In the example below, a highly concentrated calibrator was purposely injected to cause saturation on the high end of the calibration range (Figure 5). The automatic outlier algorithm was easily applied, removing the highly concentrated sample from the calibration curve and improving the fit and correlation of the concentration curve (Figure 5, bottom).
Figure 5. Automatic outlier rejection improves data quality. (Top) MRM traces for 2-Furanyl Fentanyl across the concentration range. (Middle) Concentration curve across all 6 concentrations, showing saturation at the highest concentration, resulting in poor linear fit. (Bottom) Automated outlier rejection removed the top concentration which provided a much better linear fit for the concentration curve.
Conclusions
The QTRAP 4500 System combined with the ExionLC AC System enabled the separation of fentanyl, its analogues, and metabolites, while maintaining the sensitivity at low concentrations in complex biological matrices such as human whole blood. The Scheduled MRM Algorithm in Analyst Software 1.7 and the speed of the QTRAP 4500 System produced ample acquisition points for quality data that is easily quantifiable.
- Baseline separation of fentanyl analogues and isomers
- LC chromatographic method can be used on other platforms, including the SCIEX X500R QTOF, for screening and confirmatory techniques.
- Dynamic range for quantitation averaged ~4 orders of magnitude across the compounds monitored in this study
 Click to enlarge
 Click to enlarge
 Click to enlarge
 Click to enlarge
 Click to enlarge
 Click to enlarge
 Click to enlarge