Methods
Sample preparation: Five pooled samples were prepared from discarded serum and plasma specimens. Samples (0.5 mL) were denatured using 2 mL of acetonitrile with 1% formic acid followed by centrifugation. The supernatant was passed through an Agilent Captiva EMR-lipid cartridge (300 mg), and the eluent was evaporated under a nitrogen stream and reconstituted in 200 µL of 1:1 water and methanol (1% formic acid).
Analytical standards: The EPA 533 PFAS list was selected as the target analytes. Analytical standards were purchased from Wellington Laboratories (Guelph, ON, Canada).
Chromatography: Chromatography was performed using the ExionLC system from SCIEX. Analytes were separated using a Phenomenex Gemini C18 (110 Å, 100 x 3 mm, 3 μm particle size) column using gradient conditions and a flow rate of 0.5 mL/min. The mobile phases were water (“A”) and methanol (“B”), both modified with 10 mM ammonium acetate. The column oven was 40ºC and the injection volume was 10 µL. Initial conditions were 20% “B” held for 1 min and then increased to 99% “B” over 3.5 min.
Mass spectrometry: Analysis was performed on the X500R QTOF system with the Turbo V ion source using an electrospray ionization (ESI) probe in negative ion mode. Data was collected using MRMHR acquisition mode with compound-specific, optimized parameters. The TOF MS scan ranged from 100 to 1,000 Da using DP = -50 V and CE = -5 V. The source and gas conditions were GS1 = 60, GS2 = 60, CUR = 35, CAD = 10, TEM = 500oC and ISV = -4500 V. Serum/plasma endogenous interferences were characterized through information dependent acquisition (IDA) mode using similar conditions.
Considerations of quantification of PFAS in human matrices
Fluorine atoms have a negative mass defect (i.e., their exact mass is lower than their nominal mass, 19F = 18.9984 Da). Thus compounds that contain a high abundance of fluorine (e.g., PFAS) have lower precursor masses compared to compounds that are primarily hydrogen substituted (1H = 1.0078 Da), such as the plasma/serum endogenous interferences. Therefore, this investigation explored whether this mass defect could help differentiate PFAS compounds from non-fluorinated background ions. Also, it should be noted that monitoring the [SO3]- fragment ion (m/z 79.9574) can be challenging, as both the perfluorinated sulfonates (e.g., PFHxS and PFOS) and the endogenous interferences produce the same fragment ion during MS/MS analysis, reducing the specificity obtained in this mode.
PFOS interferences
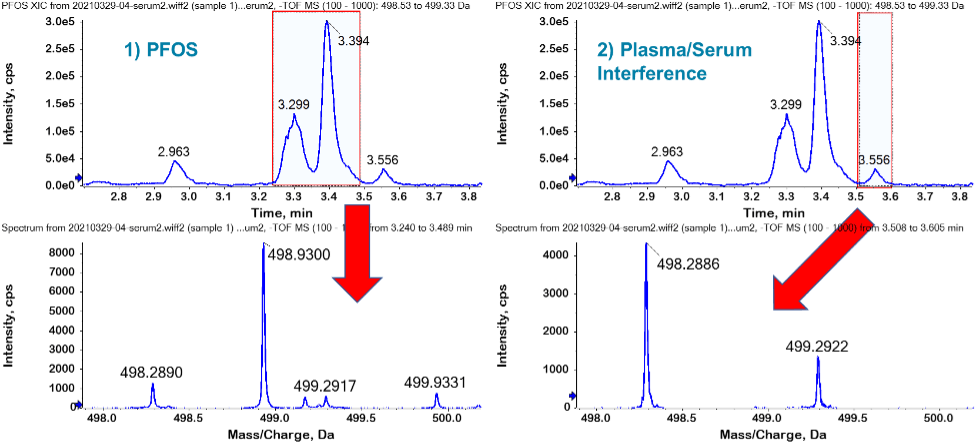
The PFOS retention time (3.3–3.4 min) was confirmed by comparison to an authentic standard in solvent. Potential PFAS interferences in the serum/plasma were investigated by setting the TOF MS extracted ion chromatogram (XIC) extraction width to 0.8 Da (i.e., m/z 498.53–499.33 Da). The 0.8 Da extraction window was chosen to represent the interferences experienced at nominal mass resolution, similar to a triple quadrupole or QTRAP system. As shown in Figure 1, the wide TOF MS XIC showed several peaks adjacent to the branched and linear isomer PFOS cluster. This was unsurprising considering that PFOS endogenous interferences have been widely reported.3
The TOF MS spectrum under the PFOS peaks showed the predominance of the theoretical PFOS precursor ion (m/z 498.9302 Da) and very minor interference contribution. This demonstrates that the endogenous PFOS interferences were chromatographically resolved from the main PFOS cluster. In contrast, the TOF MS spectrum under the 3.6 min peak showed the m/z 498.2886 ion as the precursor molecular ion and the absence of the PFOS precursor ion. These results show the benefit of using the X500R QTOF system to mass resolve the potential interferences and, in this case, confirm that the major interference has been separated from the target compound. This is important because plasma and serum samples vary widely in composition, and chromatographic separation may not always be possible.
To identify the PFOS interference, an extended chromatographic gradient was used with IDA to obtain MS/MS fragmentation spectra (Figure 2). Library matching was performed against the NIST 2017 MS/MS library for structure elucidation. The MS/MS spectrum matched to several possible taurine-based cholic acids (Figure 2), as previously reported.4 Specifically, the MS/MS spectrum shows the presence of the [SO3]- fragment, demonstrating the benefits of using high-resolution mass spectrometry (HRMS) to resolve this interference from PFOS. In the case of multiple reaction monitoring (MRM) analysis, these 2 masses would have been extracted within the same Q1 isolation window and would exhibit the same fragment ion.
PFHxS interferences
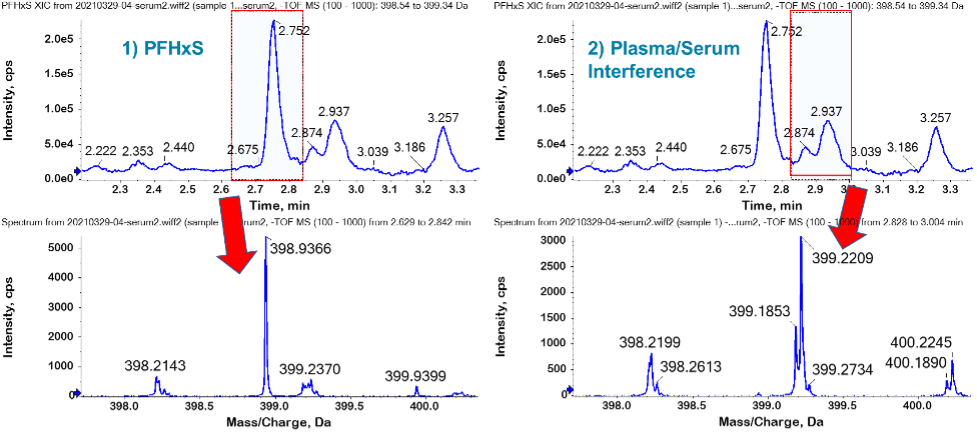
Similar to the investigation of PFOS plasma/serum interferences, the PFHxS retention time was confirmed by comparison to an authentic standard (2.7–2.8 min for the branched and linear isomer cluster). The plasma/serum PFHxS interferences were observed by setting a 0.8 Da XIC width (m/z 398.54–399.34 Da). Figure 3 shows the PFHxS peak at 2.8 min in a pooled plasma/serum sample, but also several potential interferences eluting after the PFHxS peak. The TOF MS spectrum under the PFHxS peak predominately shows the expected m/z 398.9366 Da precursor ion, which is consistent with the theoretical PFHxS ion. In contrast, the TOF MS spectrum under the 2.9 min peaks shows 2 main precursors at m/z 399.1853 Da and 399.2200 Da. These endogenous compounds were ~0.3 Da larger than the PFHxS precursor ion, demonstrating that the X500R QTOF system was capable of mass resolving the interferences and improving data quality through the reduction of false positives.
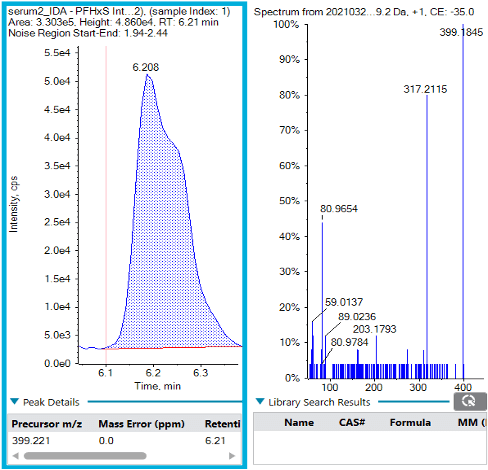
The endogenous PFHxS interferences were further interrogated by extending the chromatographic gradient and acquiring MS/MS fragmentation spectra using IDA (Figure 4). The main interference peak at m/z 399.2209 Da was detected at 6.2 min, and the formula finder in SCIEX OS software identified the formula as C21H36O5S (mass error = 0.0 ppm, isotope ratio difference = 2.2%). The MS/MS fragmentation pattern contained the [HSO3]- ion but did not have a confirmed library match, so the exact structure is unknown.
High resolution provides more specificity
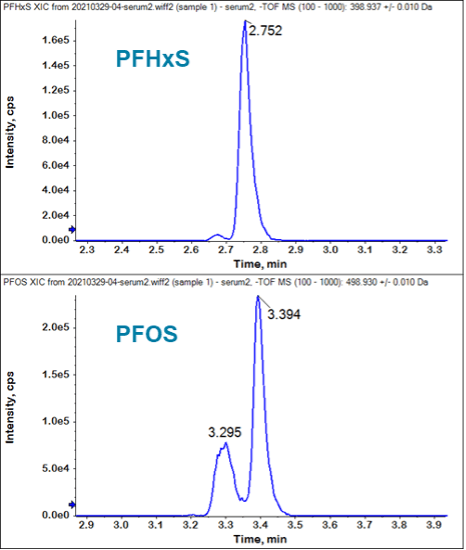
XICs were generated again using narrow extraction windows to highlight the advantages of using higher-resolution platforms to characterize a sample in comparison to traditional MRM-based workflows.5 Figure 5 shows the PFHxS and PFOS XICs resulting from a narrow 20 mDa XIC extraction width. Compared to Figure 1 and Figure 3, this clearly shows the benefits of using the X500R QTOF system for PFAS analysis in biological tissues. It has the ability to mass resolve the PFAS analytes from endogenous interferences, thereby reducing false positives and improving data quality.
Conclusions
Here, the ability to use the negative mass defect of the heavily fluorinated PFAS compounds to differentiate these target compounds for endogenous compounds was explored. Using PFOS and PFHxS as examples, narrow width XICs of the precursor mass enabled the compounds to be clearly differentiated from the background ions, demonstrating that the X500R QTOF system had sufficient resolving power to separate. Using optimized chromatography, the background ions were separated from the target analytes and full scan MS/MS was acquired to try and identify the endogenous compounds. The PFOS interference was found to likely be taurine-based cholic acids while the PFHxS did not produce a library match.
 Click to enlarge
 Click to enlarge
 Click to enlarge
 Click to enlarge
 Click to enlarge