A simplified, integrated solution for untargeted metabolomics
Routine discovery workflows with the X500R QTOF System
Baljit K. Ubhi1 and Timothy J. Garrett2
1SCIEX, CA, USA, 2University of Florida, FL, USA
Abstract
Mass spectrometry is a key tool for scientists studying metabolomics, to enable the measurement of the cellular metabolic state at a given point in time, including intermediates, conjugates, hormones, and even exogenous metabolites from food or the environment. The X500R QTOF System is an easy to operate, benchtop system for untargeted metabolomics. Here, a pilot study of prostate cancer samples was performed and a clear difference between healthy and disease urine samples were detected using MarkerView Software. Compound identification was done through SCIEX OS Software and structural matching through the ChemSpider database.
Introduction
Metabolomics focuses on the chemical processes central to cellular metabolism, giving scientists a snapshot of the cellular metabolic state, or metabolome at a given time. It consists of intermediates, conjugates, hormones, and even exogenous metabolites from food or the environment that have an impact on health. Mass spectrometry is the tool of choice for the measurements of these metabolites. However, they can be increasingly challenging workflows to setup for the novice metabolomics researcher or the technician. Therefore, a robust solution for screening metabolomics samples is of increased interest and the need for a more integrated and routine mass spectrometry system is in demand. The X500R QTOF System was developed for routine, robust workflows and requires minimal MS expertise. The system integrates all data acquisition; processing and review as well as reporting into a single piece of easy to use, easy to learn software.
Cancer research represents a key area where metabolomics can provide new biomarkers of disease from easy to obtain biofluids such as urine or plasma. An untargeted screening approach using mass spectrometry that can be adopted by a broader range of research labs (not only the expert labs) would enable this valuable research to be more broadly performed. Here a small pilot study using a urine sample set from a previous prostate cancer study was used to determine whetherthe untargeted metabolomics workflow using the X500R System could find key differences between the samples.
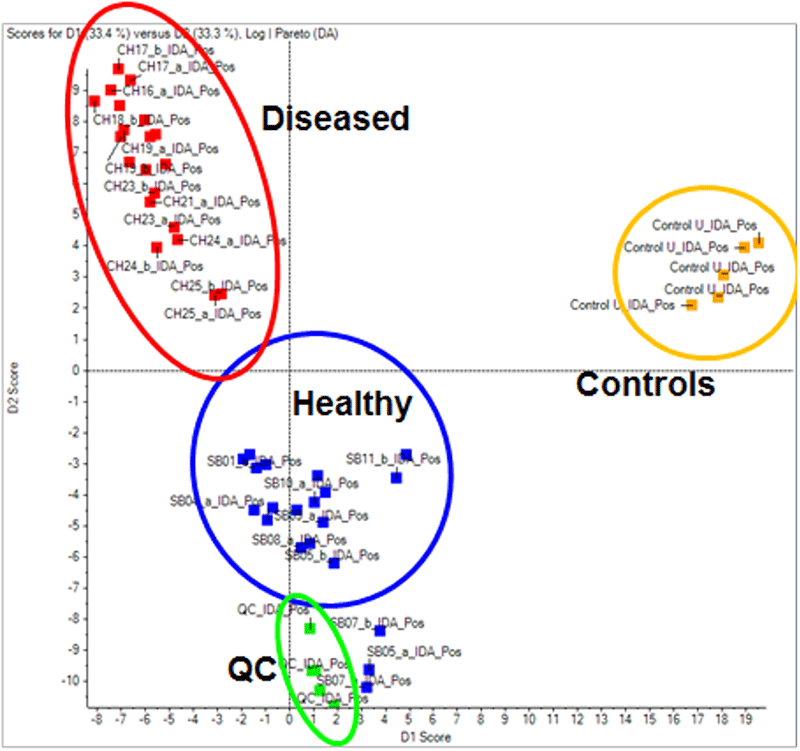
Figure 1: Metabolomic profiles can clearly differentiate diseased from healthy samples. Using the untargeted metabolomics strategy described here, samples from a prostate cancer study were analyzed, as well as QC samples (spiked with known compounds) and a control matrix sample (urine). Shown in the above Scores plot, PCA analysis clearly differentiates healthy from disease and samples, confirming the original sample classification. Samples within the same group cluster together highlighting the reproducibility of the technique. The related loadings plot is used to determine which peaks are responsible for this differentiation.
Key benefits of the untargeted metabolomics workflow on the X500R QTOF System
- Simplified operation with new interface and workflow setup powered by SCIEX OS Software with minimal MS expertise.
- Get to actionable results quickly with user-friendly processing software and libraries
- Maximize lab efficiency using a robust and integrated system with automated calibration and a benchtop footprint
Methods
Sample Preparation: Urine samples were obtained with disease classifications that were previously determined using accepted clinical techniques. The specific gravity of the samples was measured by testing 15 µL of urine samples with a refractometer prism. A 50 µL volume of the thawed urine samples was then transferred to a clean, labeled microcentrfuge-filter tube. An isotopically labeled internal standard mixture (20 µL) was added. The urine sample was then diluted with 400 µL 98:2 acetonitrile/water with 0.1% sodium azide, then vortexed. The sample was then centrifuged, and the supernatant was isolated. This was then dried down and reconstituted in 50 µL of 0.1% formic acid in water. The samples were transferred to glass vial and loaded into the autosampler.
Chromatography: The reverse phase HPLC separation was performed using a Shimadzu LC System, operating at a flow rate of 350 µL/min. The column used was an Ace Excel C18-PFP column (100 x 1mm, 2 µm) from ACE, maintained at 30 ºC. A standard reverse phase gradient was used employing mobile phase A as 0.1% formic acid in water and mobile phase B as acetonitrile. The injection volume was 3 µL in positive ion mode and 5 µL in negative ion mode.
Mass Spectrometry: The data was collected using information dependent acquisition (IDA) on the X500R QTOF System. Using optimized source conditions, the MS mass range analyzed was 50-600 m/z and the MS/MS was acquired with a mass range of 40-600 m/z with a 25 msec accumulation time. The collision energy was set to 35 V with a 15 V collision energy spread to ensure high quality MS/MS on most metabolites.
Data Processing: The data was processed in MarkerView™ Software 1.3 and PCA analysis was performed. Ions of interest were saved as an Interest List and copied into SCIEX OS Software where a formula was generated for each mz - RT ion pairs. These formulae were scored using MS and MS/MS data, then searched using the ChemSpider database.
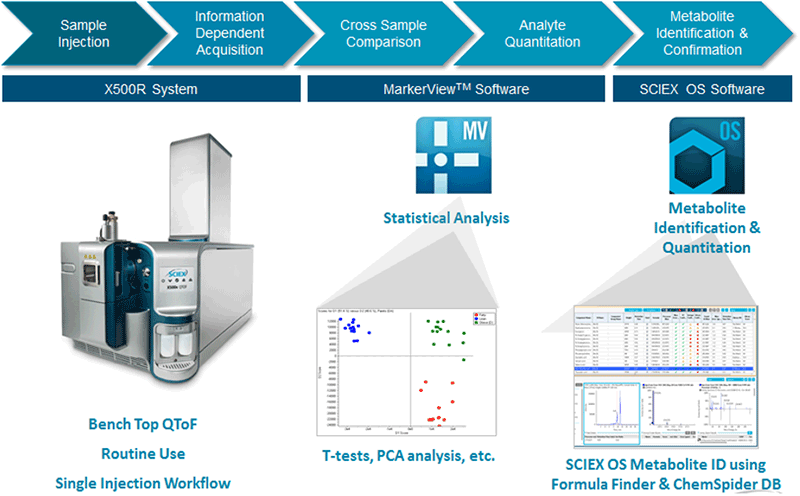
Figure 2: Untargeted metabolomics workflow pipeline. The X500R System enables the single injection workflow for untargeted metabolomics because of the high speed, high quality MS/MS acquisition. Statistically significant differential features are determined MarkerView™ Software 1.3, then features of interest can be identified using the automated tools in SCIEX OS Software. |
Finding the differentiating features
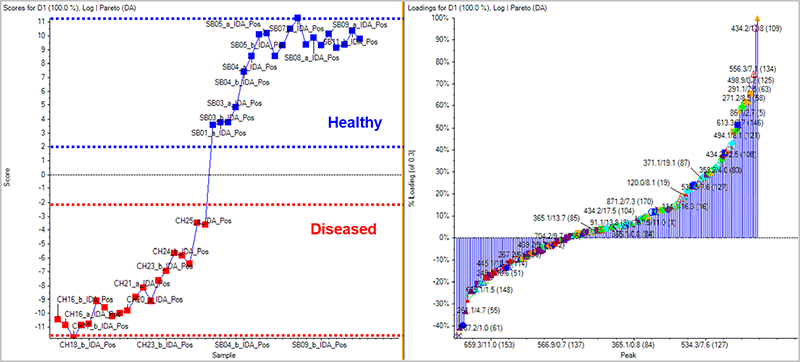
Using untargeted metabolomics one can differentiate sample groupings based on their metabolic profiles. MarkerView Software can view any trends or clustering within a dataset and tie them back to the sample groupings to find ions of interest responsible for the differences. In this pilot prostate cancer study, the samples with known disease classifications as well as QC samples (spiked with mix of known standard compounds) and the control urine (matrix QC) were analyzed by MarkerView Software. In Figure 1, the PCA scores plots shows that the samples from the same group cluster together well highlighting good reproducibility across the data collection. Removing the control urine and QC samples and repeating the PCA, a clear differentiation between the groups of samples is seen, highlighting that the metabolic profile is different between healthy and disease samples (Figure 3, left). The loadings plot highlights the m/z - RT ion pairs responsible for causing the differentiation between the groups (Figure 3, right), with the features higher in concentration in healthy vs disease on the right and those features lower in concentration in healthy vs disease on the left.
Figure 3. Scores and loadings plot from MarkerView Software. The QC and Control samples were removed from the same dataset as in Figure 1, leaving only a comparison of the healthy and diseased samples. (Left) There is a clear differentiation between the known sample groups highlighting that the metabolic profile is quite different in the diseased samples. (Right) The loadings plot highlights the m/z - RT ion pairs responsible for causing the differentiation between the sample groups. The features higher in concentration in healthy vs disease are shown to the right and those features which are lower in concentration in healthy vs disease are shown on the left. The m/z - RT ion pairs of interest are saved to an interest list and taken forward for automatic identification into SCIEX OS Software.
Identifying the metabolites
At this stage these m/z - RT ion pairs are still features therefore need identification and confirmation. The m/z - RT ion pairs of interest are saved to an Interest List and copied directly into SCIEX OS Software for identification (Figure 4, Analytics pane). Analytics allows data processing such identification (library search against SCIEX libraries), peak integration, quantitation and any other statistics which may need to be reviewed for confidence in assignment. In Figure 4, selecting the m/z in the left panel of Components and Groups displays the extracted ion chromatogram (XIC) as well as the MS and MS/MS spectra for review. The Formula Finder algorithm then generates a set of possible formulas on an unknown ion based on the parent mass, mass error and isotope distribution pattern. These formulas can then be searched in the ChemSpider database for possible structures (Figure 5).
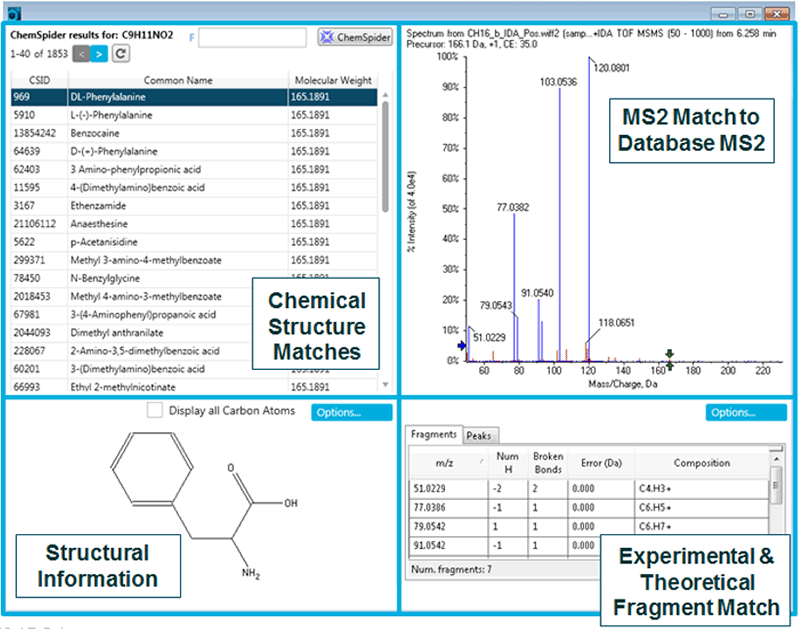
In the example shown (Figure 4 and 5), a particular ion of interest (166.0859 m/z) with a formula of C9H11O2, matched many different structures in the ChemSpider database – specifically 1853 structures. To determine which structure is the correct match, the experimental MS/MS for that m/z is matched to the theoretical fragment pattern of each of the returned structures. In this case, the first match in the list is DL-Phenylalanine (Figure 5). Selecting that match, the structure is displayed, as well as the MS/MS matching to the theoretical fragments, and the resulting mass error. This rich information confirms the differential feature found to be unusually higher in a few samples is phenylalanine. Other small metabolites were found to be differential between the healthy and diseased samples which are known and reported elsewhere.
Figure 4: SCIEX OS Software – Analytics. The m/z - RT ion pair list is copied and pasted directly into the Analytics portion of SCIEX OS Software. Analytics allows data processing such identification (against SCIEX libraries), peak integration, quantitation and any other statistics which may need to be reviewed for confidence in assignment. In the example above the m/z highlighted in the left panel of Components and Groups is extracted below (highlighted by the blue box) and the extracted ion chromatogram is available for review. The resulting MS and MS/MS spectrum can be seen in the panels to the right. Analytics is linked to smart formulae searching using the Formula Finder algorithm and can generate a formula on an unknown ion based on the parent mass, mass error and isotope distribution pattern. These formulas can then be searched in the ChemSpider database (icon highlighted in red) for possible structures (Figure 5).
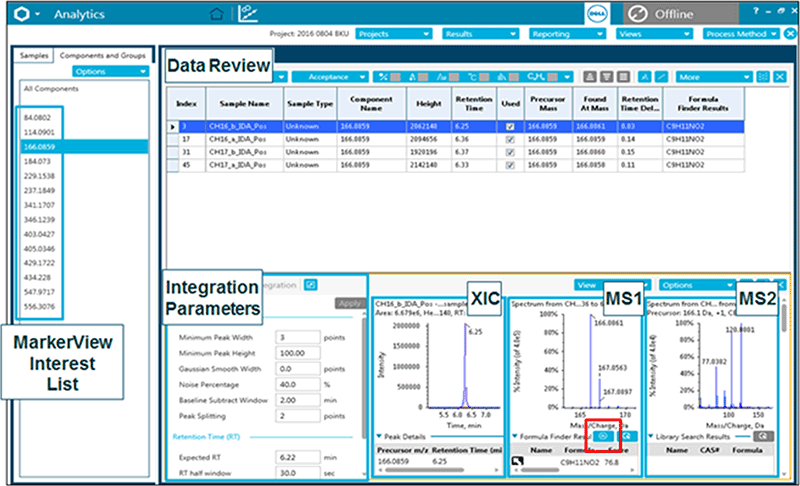
Figure 5: ChemSpider database matching. Formulae assigned in SCIEX OS Software (analytics) can be searched through the ChemSpider database for structural matching. The experimental data is matched to MS/MS spectra from theoretically fragmented potential candidate structures in order to confirm the identification. Here Phenylalanine was identified as a key metabolite that was up-regulated in healthy samples vs disease.
Conclusions
The X500R QTOF System is a robust easy to operate, benchtop system that requires minimal MS expertise to perform untargeted metabolomics analyses. As metabolomics continues to expand in disease research, robust easy-to-use solutions that provide quality answers will be increasingly important.
In this study, samples from a pilot prostate cancer study was analyzed and a clear difference between healthy and disease urine samples were detected using this untargeted metabolomics approach, confirming the original disease classifications. MarkerView Software was used to determine a list of the statistically significant analytes that distinguished the samples, and then the SCIEX OS Software compound searching provided formulae finding as well as structural matching through the ChemSpider database. This pilot study provided confidence in the approach and the next larger phase of the study analyzing a much larger set of samples is underway.