Microflow chromatography: bridging the sensitivity gap for quantitation of a pyrrolobenzodiazepine dimer
Using the QTRAP® 6500+ System with OptiFlow® Turbo V Source
Rolf Kern
SCIEX, USA
Abstract
Detection of genotoxic nitrosamines in various drug products over the last few years has driven the need for analytical techniques that can quantify these compounds at very low levels to maintain the safety of pharmaceutical products. Here, an assay was developed on the QTRAP 6500+ System for the quantitation of 8 nitrosamines. In addition, MRM triggered MS/MS was performed during the assay to allow for confident confirmation of each of the nitrosamines.
Introduction
Pyrrolobenzodiazepine dimers (PBD’s) are a class of engineered, highly potent, covalently binding DNA crosslinking agents derived from the natural product anthramycin. These compounds are able to induce cell death at concentrations in the low picomolar range, as such, they are generally considered too toxic to use by themselves as oncology treatments. But they are an attractive option for use as “warheads” for antibody drug conjugates (ADC’s) being developed to treat specific forms of cancer that selectively express an identified target membrane protein.
ADC’s are made up of an antibody designed to selectively bind to the specific target protein expressed by the cancer type, a small molecule toxin that will kill the cell the antibody binds to and is internalized by, and a linker joining the two that can be cleaved by intracellular proteases. These complex molecule types present unique bioanalytical challenges. Ligand binding assays are typically used to quantitate the antibody backbone. In some cases, LBA’s can be developed specifically for the drug conjugated antibody. This allows differentiation of conjugated and unconjugated antibody but does not provide information about the drug to antibody ratio or the toxin itself. In both research and clinical settings, the concentration of the unbound small molecule toxin is also monitored, typically by LC-MS/MS, to understand the degree it is systemically released through undescribed enzymatic activity or due to instability of the linker.
PBD based ADC’s are highly potent, and thus dosed at very low levels, often in the microgram per kg range3. For an assay to be useful in assessing nonspecifically released, freely circulating small molecule, it has to be of the highest sensitivity possible. This is complicated by the observed poor sensitivity these compounds can exhibit in ESI mass spectrometry, with published methods listing LLOQ’s in the single to double digit ng/ml ranges.1,2
Here, three key technologies were combined to develop a very high sensitivity LC-MS/MS assay for the model PBD compound. A high sensitivity quantitative assay was developed an LLOQ of 0.5 pg/mL in rat plasma.
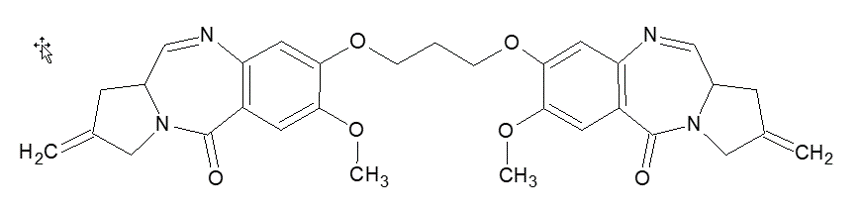
Figure 1. Molecular Structure of SJG-136. Pyrrolobenzodiazepine dimers (PBDs) are highly potent and of interest for oncology applications. SJG-136 was selected as a model compound for this class of drugs to demonstrate this high sensitivity method.
Key features of the microflow LC-MRM quantitation assay
- Here, an optimized solid phase extraction method was combined with microflow LC on a QTRAP 6500+ System to develop a high sensitivity assay for a model PBD compound
- Phenomenex Strata-X Microeleution SPE plates treat up to 200 µL of plasma and allow for very small elution volumes.
- SCIEX OptiFlow Turbo V Source is a robust, adjustment-free source for low flow LC applications
- Reducing flow rates from the typical analytical flow rates down to microflow rates typically provides gains in assay sensitivity 6
- SCIEX QTRAP 6500+ System for LC-MRM analysis provides for high sensitivity quantitation
Methods
Preparation of standards and blanks: K2EDTA Rat plasma (Bioreclamation IVT) was aliquoted into 2 ml Eppendorf tubes. Pure SJG-136 (AChemTek, Inc.) was dissolved in DMSO to make a 1.25 mg/mL stock solution, which was stored at -80oc when not in use. Working standards were serially diluted from this stock to concentrations 20 times higher than the nominal standard concentrations. 0.04 mL of the working standards were added to the aliquoted plasma, which was briefly vortexed to mix. A 0.2 mL aliquot of each matrix standard was prepared in triplicate for this experiment. Matrix blanks had 0.04 mL of DMSO added to aliquoted blank plasma.
Solid phase extraction procedure: Phenomenex Strata-X Polymeric Revered Phase, microelution 96 well plates (p/n 8M-S100-4GA) were used for sample cleanup. All elutions were done using an Eppendorf plate centrifuge, at 1000 RPM. Each well was initially conditioned with methanol, then equilibrated with LC-MS grade water. The wells were then loaded with the plasma samples and washed to waste. The samples were then washed with 10% methanol. Samples were eluted into a collection plate with acetonitrile. They were then evaporated just to dryness under a gentle N2 stream and reconstituted with HPLC grade H2O.
HPLC conditions: A NanoLC™ 425 System (SCIEX), with a 1-10 µL/min flow module and a 20 mL injection loop in direct injection mode was used. The mobile phases were A) water with CH3COOH and B) CH3CN with CH3COOH. A Phenomenex Luna Omega Polar C18 50x0.3mm, 1.6 µm (P/N 00B-4760-AC) was fitted directly in the column oven mounted on the source. For more method details, download the supplementary methods.7
MS/MS Conditions: A SCIEX QTRAP 6500+ System, operated in positive MRM mode was used for analysis. An OptiFlow® Turbo V Source with a microflow probe and a 25 µm ID electrode was used. As will be discussed in the next section, no internal standard was used for this experiment. For more method details, download the supplementary methods.7
Solid phase extraction optimization
A well-developed solid phase extraction procedure can improve assay sensitivity by removing endogenous matrix components that elevate baseline signal and introduce ionization suppression, and by concentrating target analytes in the sample. Phenomenex Strata-X polymeric reverse phase microelution SPE plates were selected for this assay because of their ability to both handle larger plasma volumes (up to 200 µL), and their compatibility with using small elution volumes ( as low 25 µL). Because the elution step for this phase is done with a high percentage of organic, the small elution volumes dramatically decrease the time required of a dry-down step for reconstitution with a more aqueous solvent for reverse phase LC separation.
Microflow chromatography for increased LC-MS sensitivity
The low flow rates used in microflow chromatography allow for increased electrospray ionization efficiency which can result in sensitivity gains of 10-fold over traditional high flow chromatography.6 In cases of difficult to ionize compounds, the sensitivity gains can be even higher. Microflow techniques suffer from a perception that they are difficult to run in a robust enough manner for routine bioanalytical work. Also, some ionization sources require proprietary column configurations can limit the flexibility to select from various column chemistries and dimensions. The OptiFlow Turbo V Source has been designed to alleviate both these limitations. The probe and electrode design are fixed in an optimized position for flow rates from 1 to 200 µL/min. The column heater is integrated with the source housing in a manner that allows the analyst’s column of choice to be attached directly to the probe inlet fitting, minimizing post-column dead volume. This is using the standard 1/16 fitting allowing use with a broad range of column chemistries and dimensions.
When evaluating sensitivity, it’s often difficult to do a direct comparison of standard analytical flow to microflow. Because of the dramatic differences in flow rates, on the order of 100x, there are many variables (injection volumes, chromatographic peak widths, column phase, etc.) that need to be taken into account to provide a “true” comparison between the two techniques. In this example, a solid phase extraction sample preparation was used, which removes salts from the samples so that larger, direct injections could be used in both flow regimes without the need for a trap and elute configuration or a desalting divert valve. A 20 µL injection volume was used for both standard and microflow modes, the same mobile phases were used for both, and the same column phase (Phenomenex Luna Omega Polar c18), in column dimensions appropriate to each flow rate, was used for comparison.
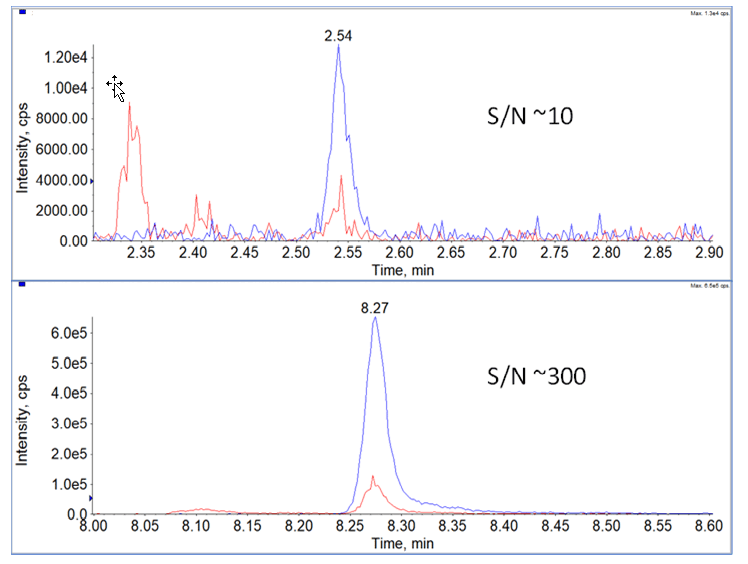
During the method development process, prepared matrix standards were run in both analytical flow (600 µL/min on a 50x2.1mm, 1.6 µm column) and in microflow (7 µL/min on a 0.3x50mm, 1.6 µm column) to assess the sensitivity and signal to noise differences between to two approaches. As can be seen in Figure 2, chromatographic peak widths for both techniques were approximately 3 seconds. Signal intensity gains and signal to noise improvements for microflow were both around 30-fold over high flow. These were measured on the same QTRAP 6500+ System, just swapping the source and LC systems used for each assay.
Figure 2. Increased Assay Sensitivity Using Microflow Chromatography. Using a concentration of 39 pg/mLSJG-132 in plasma, the optimized assays for analytical flow and microflow were compared. (Top) The chromatogram for the 2 MRM transitions are shown for the analytical flow assay, the quantifier had a S/N ratio of ~10. (Bottom) For the same sample run using the optimized microflow assay (7 µL/min), the S/N of the quantifier MRM was significantly higher, ~300.
Evaluation of limits of quantitation
In addition to selecting microflow chromatography for increased sensitivity, the QTRAP 6500+ System was also chosen for its very high sensitivity for targeted quantitative assays and proven robustness for bioanalytical assays.
The calibration curve was prepared over a nominal range of 0.5 to 1000 pg/mL in rat plasma. Despite the lack of a readily available, deuterated analogue of the SJG-136, the method proved to be reproducible (n=3, <10%CV at all concentration levels) and linear over the range that was evaluated (Figure 3). Use of an appropriate internal standard could have been of some benefit, and is a recommended, accepted practice for bioanalytical work.
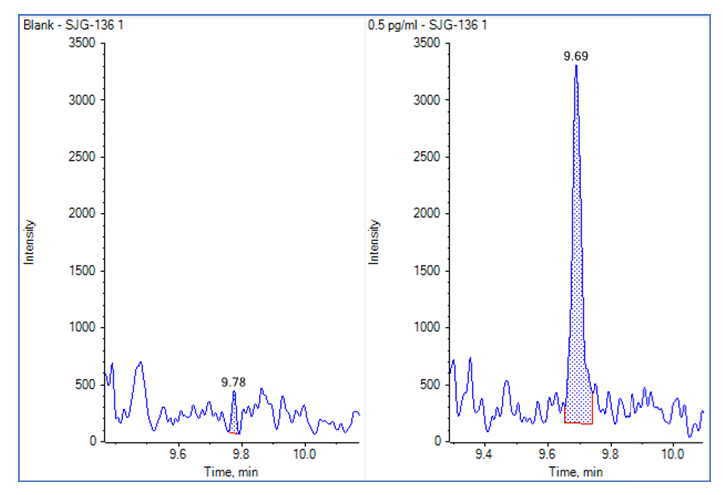
A representative chromatogram and matrix blank is shown in Figure 4.
Figure 3. Linear Calibration Curve for SJG-136. The calibration curve for SJG-132 in plasma was demonstrated to be linear over the concentration range of 0.5 to 1000 pg/mL.
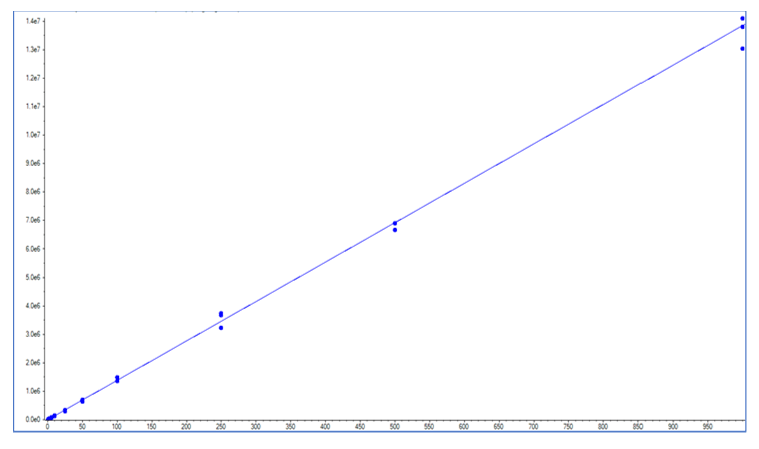
Figure 4. Evaluating Lower Limits of Quantitation for the Microflow Assay. The matrix blank was very clean (Left) and good signal was observed for the LLOQ at 0.5 pg/mL (Right).
Challenges of analyzing PBD toxins
The bioanalysis of pyrrolobenzodiazepine dimers presents a few notable difficulties. Despite initial appearances, they ionize poorly by ESI mass spectrometry. It can be noted that APCI was also investigated in this study and resulted in significantly lower signal (data not presented here). Poor ionization, coupled with the very low expected systemic concentrations and high toxicity, makes developing a method that can generate relevant data difficult.
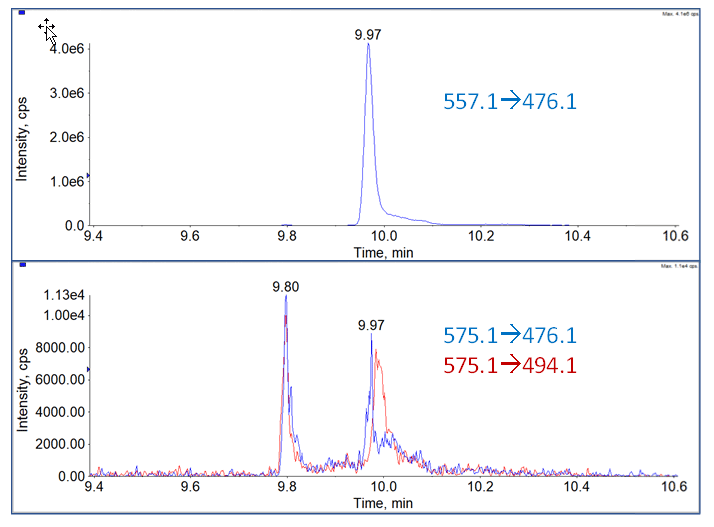
Another issue with this class of compounds is many of them are known to undergo significant hydration of the imine bond in the presence of water4 (Figure 5). This varies on a compound to compound basis, but when it does occur to a significant degree, a chemical reduction step using NaCNBH3 is incorporated into the sample preparation protocol to reduce both imine double bonds, making the compound more stable. Initial stability analyses were done as part of method development, and no signal loss was observed in the prepared extracts after storage for 4 days in the autosampler rack. MRM transitions were predicted for the imine reaction using the precursor ion +18 and the fragment ion, and precursor ion +18 and fragment ion +18. Using both the compound MRMs and the predicted MRM transitions, the method was then run on the highest standard in the calibration curve. The analysis did show a small amount (<0.5% intensity) peak for both predicted MRM traces, indicating that a small, but not significant amount of hydration was occurring (Figure 6).
Figure 5. Known Imine Hydration of PBD Toxins.
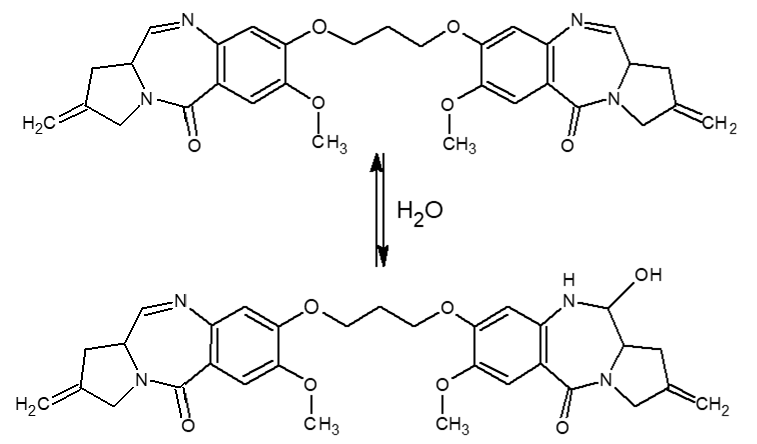
Figure 6. Testing for Imine Hydration. Top: MRM for SJG-136. Bottom: Both predicted MRM traces for hydrated species.
Conclusions
The method presented demonstrates how the use of a solid phase extraction sample preparation in combination with microflow LC on a QTRAP 6500+ System can achieve much better limits of quantitation than those using traditional analytical flow techniques. In this case, if the freely circulating small molecule component of a potent ADC is able to be detected and associated with toxic effects, it should allow researchers to further refine and develop these constructs, with goal of developing safe, effective therapies.
References
- Wilkinson G, et al. (2004) Preliminary pharmacokinetic and bioanalytical studies of SJG-136 (NSC 694501), a sequence-selective pyrrolobenzodiazepine dimer DNA-cross-linking agent. Investigational New Drugs 22(3): 231-40.
- Mantaj J et al. (2016) From Anthramycin to Pyrrolobenzodiazepine (PBD)‐Containing Antibody–Drug Conjugates (ADCs). Angwandte Chemie, 56 (2), 462-488.
- Hartley JA, et al. (2018) Pre-clinical pharmacology and mechanism of action of SG3199, the pyrrolobenzodiazepine (PBD) dimer warhead component of antibody-drug conjugate (ADC) payload tesirine. Scientific Report 8, 10479.
- Pillow TH et al. (2017) Modulating Therapeutic Activity and Toxicity of Pyrrolobenzodiazepine Antibody-Drug Conjugates with Self Immolative Disulfide Linkers. Mol. Cancer Therapeutics, 16(5), 871.
- Spirogen.
- Schneider B et al. (2006) Ion Sampling Efficiency Under Conditions of Total Solvent Consumption. Rapid Comm Mass Spec 20, 1538-1544.
- Download Supplementary Method Information.