Abstract
During drug development, rapid detection and characterization of major metabolites is required for lead optimization. Liver microsome studies are used to model hepatic oxidative metabolism of a compound and find ‘soft spots’ of oxidative metabolism, to guide medicinal chemistry efforts. In this study, the X500R QTOF System was used to study the oxidative metabolism of four model compounds - haloperidol, verapamil, buspirone and midazolam. Data was acquired using both data dependent and data independent strategies and the processed with MetabolitePilot 2.0 software. MS and MS/MS spectra was processed with both generic and predicted metabolite peak finding, then analyzed using the automatic structure proposal feature and integrated MS/MS fragment interpretation tool within the software.

Introduction
Liver microsome studies are used to model hepatic oxidative metabolism in vivo. In early discovery, compounds susceptible to rapid clearance are typically avoided. Rational drug design can overcome the issue of rapid clearance and extend the therapeutic concentration of a drug. Structural information about the sites or ‘soft spots’ of oxidative metabolism is required to establish structure-metabolism relationships and guide medicinal chemistry efforts to overcome instability. For scientists working in this area, increasing sample throughput and minimizing the time spent on data processing and structural interpretation are important to accelerate early drug discovery.
Here, a routine biotransformation solution featuring the X500R QTOF System with MetabolitePilot 2.0 software to study the oxidative metabolism of four model compounds. Data was acquired with both data dependent (DDA) and data independent (DIA) strategies and to increase sample throughput a short 50 mm column and a 5 minute gradient were used. High resolution and high mass accuracy MS and MS/MS data was acquired for metabolite identification. Generic and predicted metabolite peak finding strategies were used in MetabolitePilot software and the automatic structure proposal feature was used to speed data review.
Key features of X500R System for soft spot analysis
-
Compact benchtop X500R QTOF system featuring easy-to-use SCIEX OS Software for control and acquisition
- Intelligent and flexible data acquisition strategies featuring: SWATH® Acquisition for data independent acquisition (DIA) and real-time multiple mass-defect filtering (MDF) for data dependent acquisition (DDA)
- Fast MS/MS acquisition up to 100 MS/MS per second without compromising resolution
-
MetabolitePilot Software provides an integrated solution for determination of metabolites
- Automatic structure proposals of metabolites are generated and presented with relative evidence for quick, easy review and confirmation
- Advanced peak finding algorithms optimized for SCIEX accurate mass platforms and integrated MS/MS fragment interpretation and structural assignment tools
-
High throughput batch processing (up to 200 rows) plus the ability to import batches from a spreadsheet and create processing methods on the fly
-
Multiple sample correlation function for time course studies and inter-species comparison of metabolites
Methods
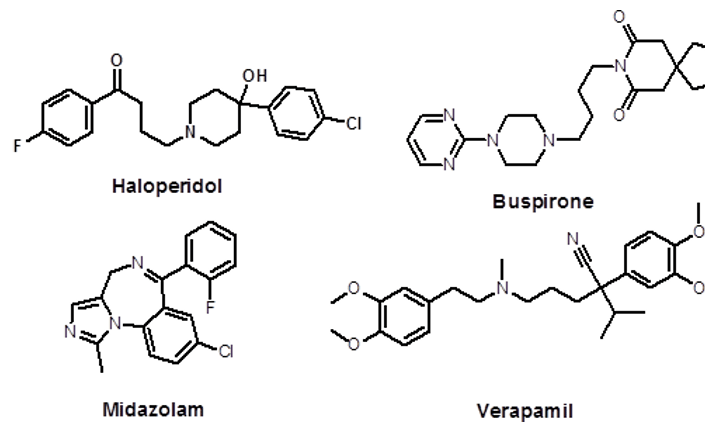
Sample preparation: Haloperidol, buspirone, midazolam and verapamil reference standard solutions (1 mg/mL) were purchased from Sigma-Aldrich. Rat liver microsomes (RLM) and Rapid Start NADPH regenerating system were purchased from Xenotech.
Compounds were first diluted in methanol to 100 mM. The concentration of organic solvent was 1% in the final incubations. Starting incubation volume was 500 µL and contained 1 mg/mL RLM, 10 µM substrate and 1.47 mM NADPH regenerating system in 100 mM potassium phosphate buffer pH 7.4. At 5, 15, 30, 60 and 90 minutes 50 µL aliquots of the mixture were taken and quenched with an equal volume of cold acetonitrile. The mixture was vortexed for 1 min and then centrifuged at 15000 rpm for 10 minutes. The supernatant was then analyzed on the X500R. The control sample (t=0) was prepared by quenching the microsomes first before adding substrate. RLM blank time point controls were prepared by incubating a mixture without substrate and taking aliquots at different time points.
Chromatography: Samples were chromatographed on a SCIEX ExionLC™ AD System using a Phenomenex Kinetex C18 column (2.0 x 50 mm), 2.6 µm. Elution was performed using a linear gradient from 5% to 40% B over 4 mins, then to 95% B at 4.5 min and held at 95% B until 5 min. The column was returned to 5% B at 5.25 min. Total run time was 6 minutes. Mobile phase A was water with 0.1% formic acid and mobile phase B was acetonitrile with 0.1% formic acid. The flow rate was 400 µL/min, the column was kept at 40 °C and 2 µL was injected.
Mass spectrometry: Data was collected on a SCIEX X500R QTOF System with SCIEX OS Software 1.2 using both IDA and SWATH Acquisition. TOF MS acquisition covered m/z 100 to 1000, with 100 ms accumulation time. Data independent acquisition was performed using SWATH acquisition with 7 variable windows sized to cover Phase I pathways. Total scan time for the SWATH acquisition method was 325 msec. IDA data were acquired with dynamic background subtraction, intensity threshold 1000 cps, exclude isotope ± 3 Da, mass tolerance ± 50 mDa and 50 ms accumulation time.
Data processing:Data was processed in MetabolitePilot 2.0 Software using the installed Phase I biotransformation list. A sample to control ratio of >3 was used. TOF MS was used to find metabolites using both the predicted and generic peak finding (mass defect filter on) algorithms. For the compounds haloperidol and midazolam the isotope pattern algorithm filter was also used. The LC-MS and MS/MS (XIC) threshold and MS/MS threshold was set to 3000 and 500 cps respectively. The Advanced MS/MS filter was used for SWATH Acquisition data processing.
Optimizing acquisition
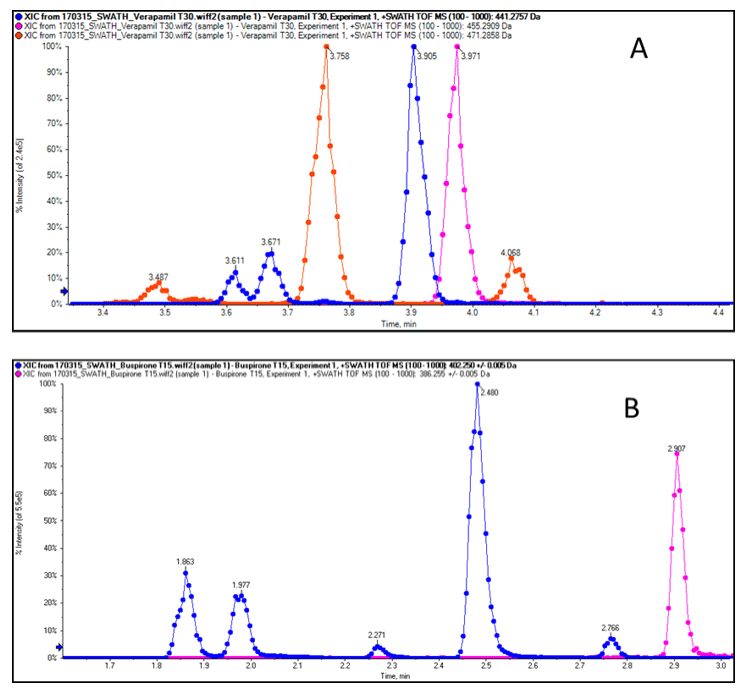
Each parent compound eluted between 2.9 and 3.7 minutes. An example chromatograms of the SWATH Acquisition data from the incubations of verapamil and buspirone are shown in Figure 2. The verapamil chromatogram shows the parent, oxidized and de-methylated metabolite TOF MS XICs. Each peak has a width of approximately 5 seconds, and the optimized variable window SWATH Acquisition approach allowed the collection of at least 12 data points across each peak. Each peak is well resolved using the 50 mm Kinetex C18 column and 5 min gradient. Similarly the oxidized metabolites of buspirone are also well resolved.
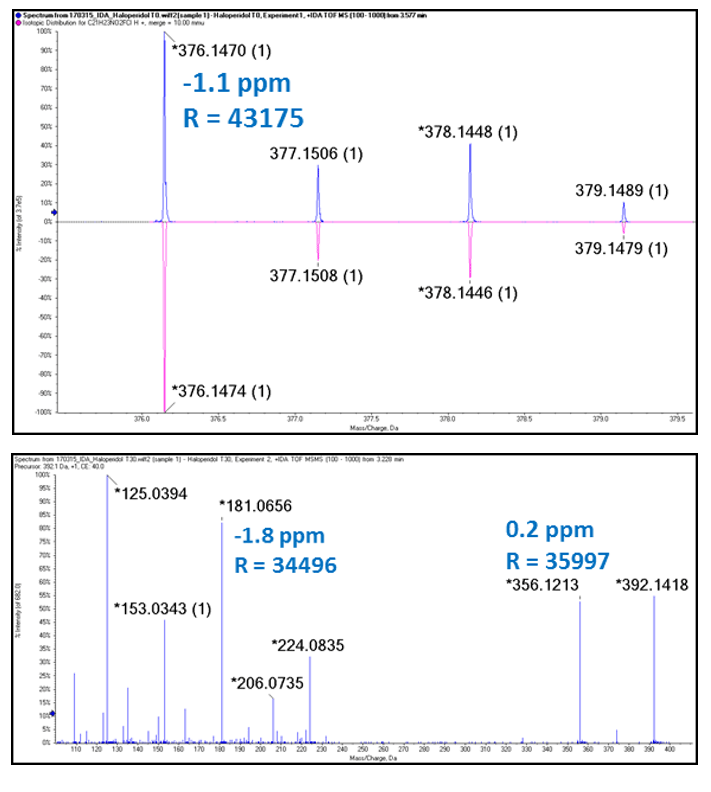
Excellent mass accuracy and resolution were achieved in both MS and MS/MS scans (Figure 3). The high mass accuracy obtained in MS/MS scans greatly facilitates structure elucidation because it allows unambiguous assignment of elemental composition. As can be seen from the number of points across the peaks in Figure 2 the data independent acquisition (SWATH Acquisition) is performed with enough speed to allow quantitation (>10 points) in both MS and MS/MS at the resolution and mass accuracy seen in Figure 3.
Streamlined data processing
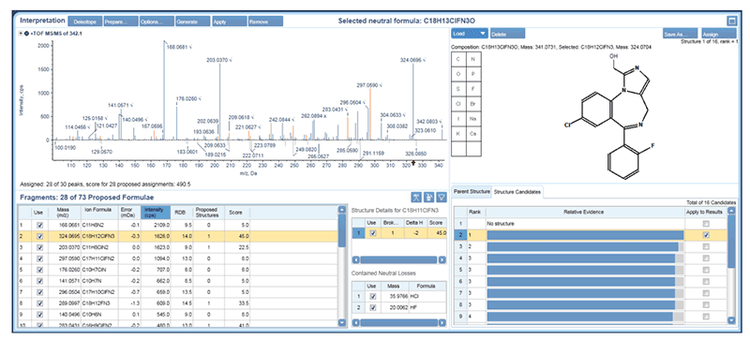
Data were processed in MetabolitePilot 2.0 Software with the auto-assign option and using the t=0 sample and RLM blank as controls. Each results table was then sorted based on MS peak area to identify the top metabolites formed at each time point. The auto-assign function of MetabolitePilot software will generate structural proposals for metabolites with: one or more cleavages, one biotransformation and metabolites with a combination of one cleavage and one biotransformation. This feature helps to speed up metabolite assignment because the user only needs to review and confirm the proposed metabolite structure using the MS/MS interpretation tool. An example of the interpretation workspace is shown in Figure 4 for the major oxidized metabolite of midazolam. There are several possible sites of oxidation and each candidate is represented with a line in the structure candidates tab. The top structure from the assignment algorithm is shown as rank F1 and the other possibilities are shown below. The strength of the evidence of the other candidates is shown relative to rank 1 and is represented as a histogram. In the case of 1’ hydroxymidazolam the metabolite structure was confirmed by matching the MS/MS spectrum with one previously reported.2 However, not all candidates can be distinguished based on MS/MS, such as oxidation on an aromatic ring and are presented with the same relative evidence (blue histogram, rank 3) and are best represented with a Markush structure.
Finding potential metabolites
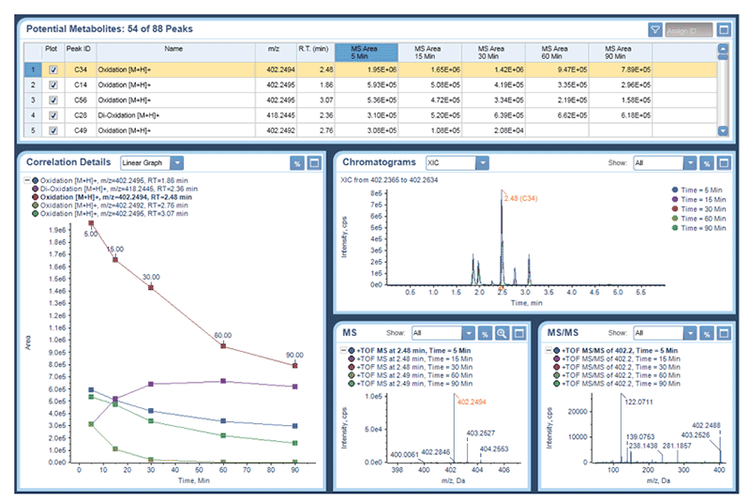
The top 5 metabolites found for each compound after 30 minutes are shown in Table 1. Buspirone metabolites included: 6’-OH, 3’-OH and di-oxidations, verapamil included: N- and O-demethylation and C-N bond cleavage, haloperidol included: pyridine oxidation, C-N bond cleavage and oxidation and midazolam metabolites included: di- and tri-oxidation.
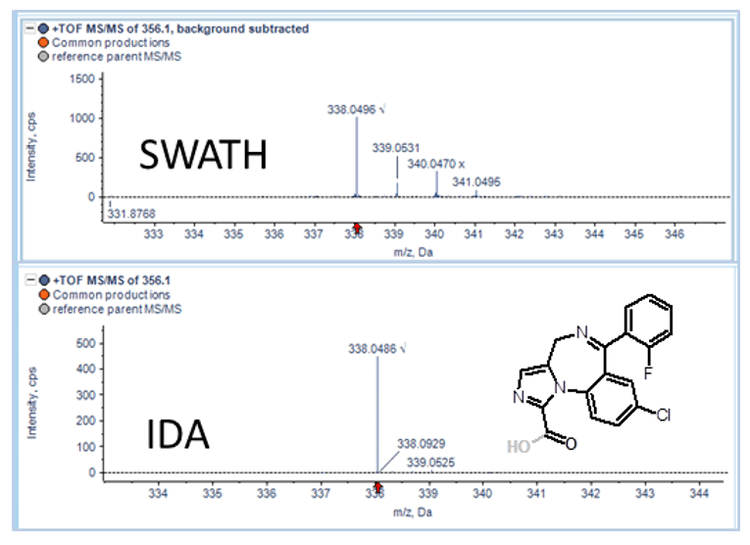
There were no differences observed in the top 10 metabolites found by either IDA or SWATH Acquisition for each compound. However as observed previously1, there were differences in the number of MS/MS spectra acquired between the two techniques for metabolites 11 to 20 (based on TOF MS peak intensity) for each compound. Not all metabolites in this intensity range had associated MS/MS spectra with IDA acquisition while 100% of the metabolites had MS/MS spectra when using SWATH Acquisition. The absence of product ion spectra for some metabolites would require reacquisition of the sample targeting the specific metabolite precursor ion. Another advantage of SWATH Acquisition is the collection of isotope pattern information in the product ion spectrum, which can be used for metabolite peak finding (Figure 5).
Conclusions
Rapid detection and characterization of major metabolites is required for lead optimization in fast paced drug discovery environments. Rat liver microsome incubations of haloperidol, verapamil, buspirone and midazolam have shown that the X500R QTOF System combined with MetabolitePilot 2.0 Software is a powerful solution for rapid soft spot analysis. Both IDA and variable window SWATH Acquisition techniques are suitable for high throughput acquisition and SWATH Acquisition offers the benefit of collecting product ion spectra for all detectable metabolite precursor ions and capturing product ion isotope pattern information. Data processing is speeded by the automatic structure proposal feature and integrated MS/MS fragment interpretation tool that performs fragment assignments all in a single integrated workspace.
References
-
- Xiaochun Zhu, et al. (2014) Comparison of Information-Dependent Acquisition, SWATH, and MSALL Techniques in Metabolite Identification Study Employing Ultrahigh-Performance Liquid Chromatography–Quadrupole Time-of-Flight Mass Spectrometry. Analytical Chemistry, 86 (2), 1202-1209.
- P Marquet et al. (1999) Sensitive and specific determination of midazolam and 1-hydroxymidazolam in human serum by liquid chromatography–electrospray mass spectrometry. Journal of Chromatography B: Biomedical Sciences and Applications, 734 (1), 137-144.
- MetabolitePilot™ Software 2.0 overview, SCIEX technical note RUO-MKT-02-4989-A.