Abstract
General approach for development of a NDMA method in pharmaceuticals is presented here. This includes the use of a standard set of columns for rapid method development, use of APCI for reduced ion suppression, use of SelexION Technology for additional specificity, and standard addition data processing for handling matrix effects.

Introduction
The analysis of nitrosamine compounds in finished pharmaceutical products has become increasingly important as more drugs are subject to costly recalls because they are contaminated with unacceptable levels of these potentially carcinogenic contaminants. Accurate quantification of the lower molecular weight nitrosamines in pharmaceutical products at the required levels can be challenging, however. The initial gas chromatography-based techniques (GC-MS) were often shown to report higher than expected values.1 Liquid chromatography (LC-MS/MS) methods can pose challenges due to the lack of a true “blank matrix” for matrix matching calibration standards. Chromatographic separation of the active pharmaceutical ingredient (API) from the nitrosamine compounds of interest is required to avoid any ionization suppression caused by the high concentration of the API.
N-nitrosodimethylamine (NDMA) is the smallest of the nitrosamine compounds of interest, making it prone to isobaric interferences and elevated baseline signal. It’s very hydrophilic, which can complicate chromatography, and it is the most commonly implicated nitrosamine contaminant in drug recalls since 2018.
The method presented here describes the use of the SelexION+ Differential Mobility Separation (DMS) Device coupled with a QTRAP® 6500+ LC-MS/MS System and atmospheric pressure chemical ionization (APCI) for the analysis of NDMA in nine commercially released metformin formulations that were generously provided by a collaborator. A rational approach to nitrosamine chromatographic method development is also presented which should allow this method to be extensible to other drug formulations with minimal effort as needs arise.
Key features of the SCIEX QTRAP® 6500+ System for nitrosamine analysis
- The SCIEX QTRAP 6500+ System is a highly sensitivity and flexible system for solving challenging quantitative problems
- Able to switch between standard ESI and APCI ionization by simply replacing the source electrode
- The SelexION+ Device provides an additional, orthogonal level of selectivity, for removal of background interferences from nitrosamine assays, and installs in minutes when required
- Set of standard columns for rapid determination of chromatography to accelerate method development

Considerations for a robust solution to the on-going nitrosamine contamination issue
Since the initial 2018 FDA issued a recall advisory for a single lot of valsartan, innumerable lots of this medication and other sartan (angiotensin II receptor blocker) medications have been recalled, with a total cost to producers that is difficult to measure. In 2019, some medications containing ranitidine (generic for Zantac) were also found to have unacceptable levels of NDMA, which caused another round of very costly recalls. In 2020, several lots of extended release formulations of the diabetic medication metformin have been subject to recall 6, again due to unacceptable levels of NDMA contamination. It is reasonable to assume strict attention will continue to be paid to nitrosamine contamination in drug products going forward.
Quantitative LC-MS/MS methods typically require calibration standards to be prepared in a blank (or clean) equivalent of the matrix of the samples being analyzed. This ensures that any matrix-based ionization effects are consistent between the samples and the calibration. But most laboratories are not going to have access to the exact, and often complex, ingredients of a pill or tablet formulated medication. This makes matrix matching calibration standards and samples challenging. APCI ionization, while often a less sensitive ionization technique than the more commonly used electrospray ionization, is known to be significantly less prone to matrix-based ionization effects, and was chosen for this analysis.
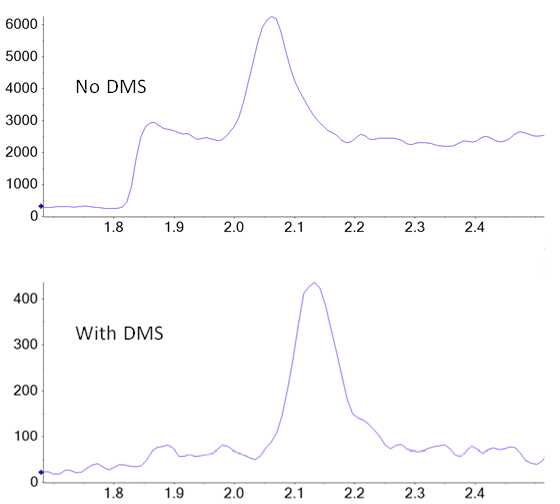
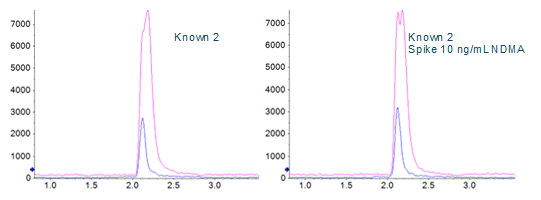
In addition to potential ionization efficiency differences between samples and standards, there is also the possibility of unknown isobaric compounds being present in the drug product, but not in the standards, interfering with accurate quantification. SelexION Technology is employed in a differential mobility separation device positioned, at atmospheric pressure, between the ionization source and the interface of the mass spectrometer. It provides an orthogonal level of separation and selectivity that can potentially reduce both baseline noise and specific interferences from other unknown isobaric species that could compromise quantification. To produce optimal separation between two species, the key parameter (the compensation voltage) can be tuned to specifically exclude the contaminating species from the signal of the target compound. In this case, there is not a “known” interferent present during method development, so NDMA was tuned individually to improve signal to noise over baseline. An example showing the difference in the signal of NDMA in a tablet extract is shown in figure 1.
Methods
Sample preparation: Generally speaking, sample preparation should capture all of the target analyte while leaving behind as many matrix components as possible, and end with a sample amenable to LC-MS analysis. For formulated medications, especially pills and tablets, the most direct preparation is to crush the sample to a powder and dissolve it in a suitable solvent. NDMA is highly soluble in water and, for some formulations, using water works well. For others, notably formulations designed for extended or slow release, dissolving in water produces a gel or slurry that is difficult to manage. In many cases, dissolving these formulations in pure methanol will yield much better results. Also, it must be taken into account that NDMA is classed as a semi-volatile compound. Any step involving evaporation or vacuum could lead to a loss of NDMA during the preparation, and potentially an under-reporting of its concentration.
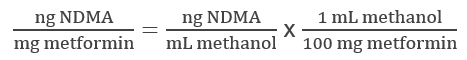
The tablets tested in this study were a mixture of immediate release and extended release, so methanol was used for consistency. The preparation chosen for this study is similar to that described in the FDA’s 2020 publication.2 The crushed formulation is dissolved in solvent (methanol) at a rate of 1 mL per 100 mg of stated API in the formulation—not based on the weight of the tablet itself. For example, 5 mL methanol for a 500 mg potency pill. The mixture was vortex mixed for 5 min and then sonicated for 15 min. The samples were allowed to settle on the bench at room temperature for 15 min, and then supernatant was taken off the top, transferred to an Eppendorf tube and centrifuged at 15000 rpm for 15 min to further clarify. Sample aliquots were carefully taken off the top and transferred to HPLC vials for analysis. At this point, the samples are in 100% methanol, which requires small injection volumes to avoid issues with chromatography.
Standards were prepared by serially diluting a stock NDMA standard (Supelco) in 100% methanol over a range of 1 to 1000 ng/mL. Additionally, separate aliquots of each of the samples analyzed were spiked to a final concentration of 5, 10 and 50 ng/mL with NDMA.
Chromatography: A critical aspect of NDMA analysis in a pharmaceutical product is the need to chromatographically separate NDMA from the API. Even when using APCI as the ionization technique, the massive amount of API present, in this case 100 mg/mL, in the extracted sample has the potential to dramatically affect the ionization efficiency of any NDMA present in the sample, if they coelute. Fortunately, chromatography for many small nitrosamines, including NDMA, has been worked out3 on at least three different column types with common mobile phases (water, methanol, 0.1% formic acid).
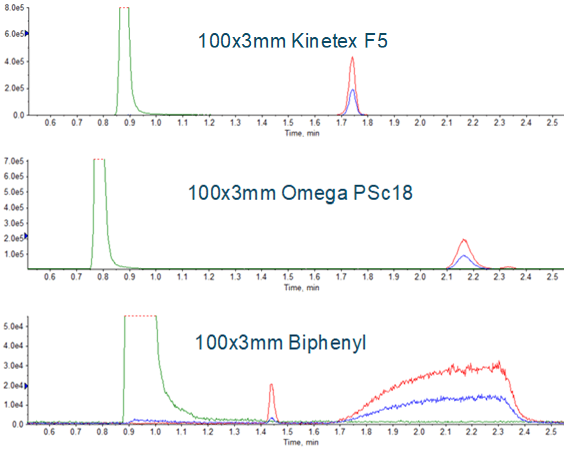
Chromatography conditions have been described for the three major medications affected so far (valsartan, ranitidine and metformin). Given the scope of NDMA contamination that has recently been observed, it is reasonable to assume that additional medications will need monitoring, requiring additional individual methods be developed. Development of a robust chromatographic method for a new medication is likely the most time consuming aspect of developing an assay. Having an approach that uses a short, generic, 5 to 95 %B gradient, and multiple stationary phases as an initial evaluation can help with this process. Examples of using this approach can be seen in Figure 3. The Phenomenex PS C18 was chosen, and the gradient was further refined, resulting in the method described in Table 1. Representative chromatography is shown in Figure 4. Note that addition of a divert step is important to prevent the large amounts of API from entering the mass spectrometer and potentially contaminating the instrument.


Use of SelexION Device for improved detection
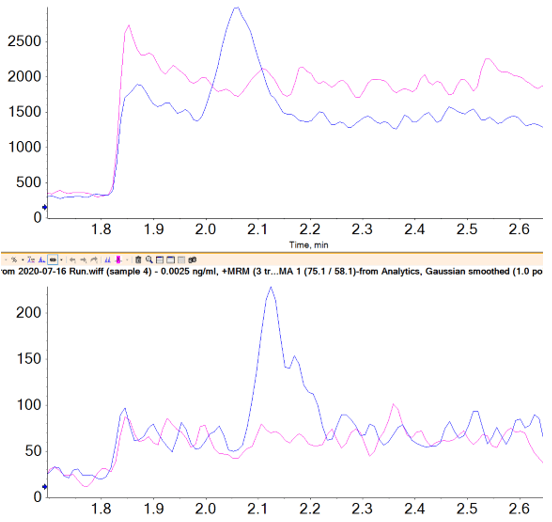
A direct comparison of the analysis done with and without DMS applied showed a signal to noise improvement of two- to three‑fold when using the SelexION Device (Figures 1 and 5), even though there is approximately a ten-fold overall signal drop when implementing it.
Limits of quantification were based on accuracy and reproducibility of opening and closing calibration curves. The runs where SelexION Device was turned on showed an LLOQ of 2.5 ng/mL (Figure 5), and the runs without DMS showed an LLOQ of 10 ng/mL. While these values might not seem as sensitive as others reported4, it must be remembered that they are based on a 1 mL injection volume because of the methanol extraction solvent. In the absence of chromatographic effects, sensitivity for this assay scales well with injection volume.
Using standard addition for quantification in the absence of an equivalent blank matrix
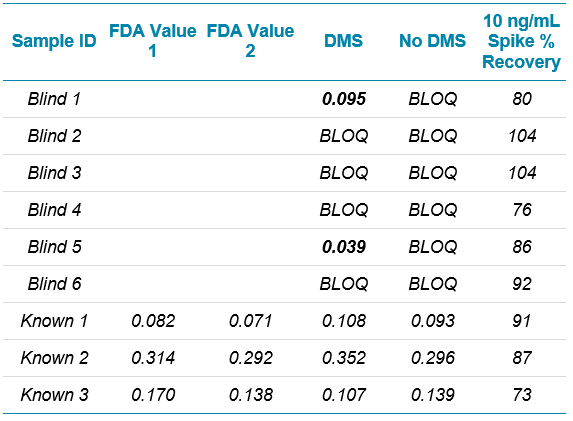
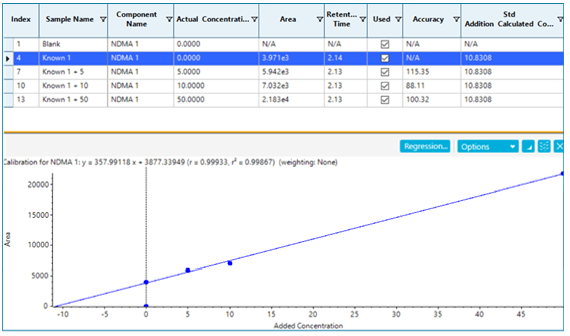
If spike recoveries were unacceptable due to a difference in ionization efficiency between the samples and the standards, a technique called standard addition could be used to quantify the NDMA level in the sample. In the pharmaceutical field, this quantitative technique is not commonly used, but in the food and environmental field, it is used when a blank matrix equivalent to the samples being analyzed is not available. This approach works by preparing the sample as normal, and also preparing the sample spiked with a few different levels of the analyte of interest. The peak areas (or analyte/IS area ratios) are plotted as concentration vs. response, with the unspiked sample considered a zero concentration. A linear regression equation is derived, and the sample concentration is then calculated to be the absolute value of the x-intercept. Figure 6 shows how this is done in the Analytics module of SCIEX OS Software as a natively available feature. In this case, it was not necessary, but the results show how closely it aligns with routine external standard quantification. While this approach can be very useful for non-matrix matched samples, it will not provide reliable results if there is an interferent that affects peak integration.
Reducing risk of DMF interference
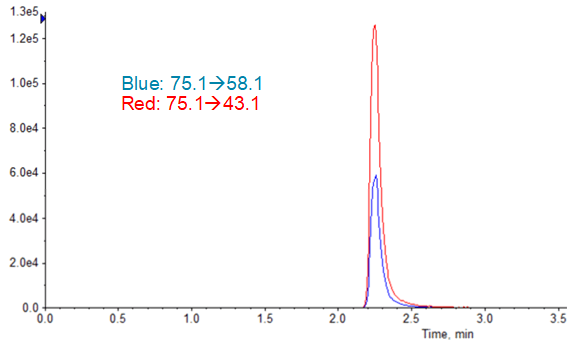
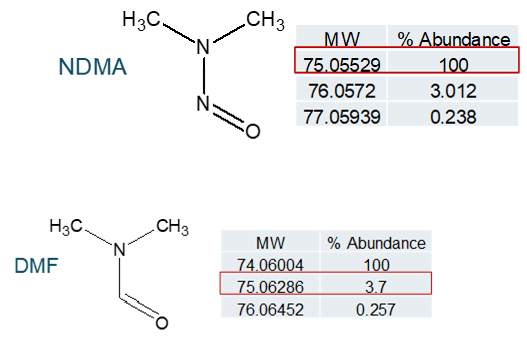
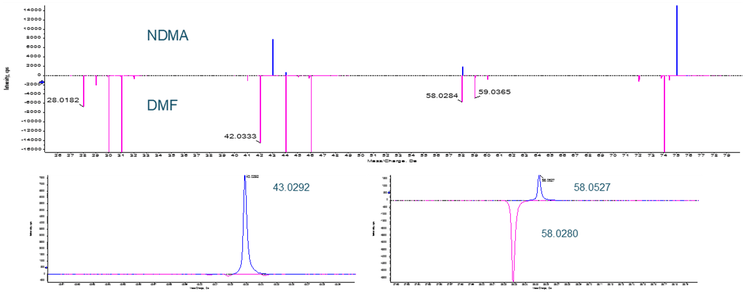
There has been mention of the potential for an isotope of the solvent dimethyl formamide (DMF), which is commonly used in bulk chemical synthetic processes, to interfere with NDMA quantification (see Figure 8). In a situation where high resolution mass spectrometry is used for quantification, DMF and NDMA are not chromatographically resolved and the parent m/z is being used for quantification, this is certainly possible. Examining the fragmentation pattern for both compounds (Figure 9), it can be seen that one of the two common NDMA fragments should not be affected by the presence of DMF, even if both are present and coeluting.
Conclusions
The approach to NDMA analysis in pharmaceutical products presented here, using several lots of metformin as a case study, outlines a general approach for efficiently developing a robust analytical method.
- Developing a chromatographic method that separates the API from the nitrosamines of interest is potentially the most challenging aspect of the assay. With multiple stationary phases that are known to work well for nitrosamines, this should prove less time consuming for new APIs that require monitoring.
- Use of APCI for ionization will increase assay robustness to ion suppression and will typically provide enough sensitivity for most requirements.
- Additional selectivity can be achieved when required by using the SelexION Device to reduce high baseline noise and potentially separate out other isobaric interferents.
- Incorporating matrix spikes adds another level of confidence in the final results and also allows for the use of standard addition quantification if significant matrix effects are observed.
Incorporation of these approaches should allow for rapid development of a nitrosamine analytical method in many types of pharmaceuticals, with the goal of confidently identifying contaminated lots of drug products prior to release, to avoid both consumer exposure to these probable carcinogens and costly product recalls.
References
- FDA white paper: https://www.fda.gov/media/130801/download
- Yang, et al. (2020) A Cautionary Tale: LC-HRMS Analytical Procedures for the Analysis of N-Nitrosodimethyamine in Metformin, The AAPS Journal (2020) 22:89.
- LC-MRM-MS Method for the Detection and Quantification of Six Nitrosamine Impurities in Sartan (ARBs) Drugs. ASMS, 2020 poster session, Eggleston-Rangel, Snow, Koerner Phenomenex Inc, CA
- A rapid method for quantifying nitrosamine compounds with qualitative confirmation, SCIEX technical note RUO-MKT-02-11191-A.
- FDA website for nitrosamine contaminants in metformin products.
- FDA website NDMA in metformin updates.