Intelligently designed SWATH® Acquisition for novel psychoactive substances (NPS) detection in whole blood
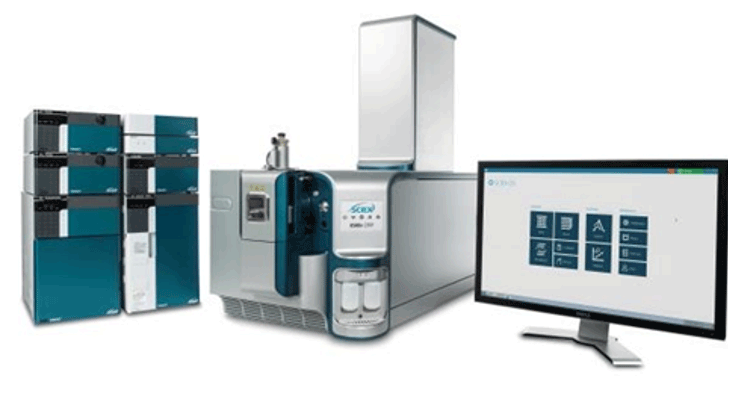
Using SWATH Acquisition on the SCIEX X500R® QTOF System
Holly McCall, Xiang He, and Alexandre Wang
SCIEX, USA
Abstract
As deaths due to novel psychoactive substances (NPS) increase each year, timely and comprehensive drug screening approaches are critical to enable forensic laboratories to rapidly and accurately identify these emerging novel substances. The ability to collect complete digital data archive for any unknown sample that can be re-interrogated as new information emerges is an advantage for forensic labs. In this study, the analytical performance of a data independent acquisition method using mass spectrometry for the screening and quantification of a panel of 54 NPS including synthetic cathinones, synthetic cannabinoids, benzodiazepines, and fentanyl analogs was evaluated using the SCIEX X500R TOF System. The performance of two different sample preparation techniques: (1) protein precipitation (PP) and salting-out liquid-liquid extraction (SALLE) was also compared.
Introduction
In recent years, there has been a significant influx of novel psychoactive substances (NPS) into the recreational drug market. These substances are designed to mimic the effects of traditional street drugs, but are specifically engineered to avoid detection. Today, synthetic cannabinoids and cathinones make up the majority of NPS commonly encountered. Analyzing these compounds is challenging as limited information is available on these drugs. In addition, their chemical composition is highly variable and so is their potency. Therefore, these substances continue to pose serious public health and safety issues.
With a large number of deaths caused by these NPS each year, timely and comprehensive drug screening approaches are critical to enable forensic laboratories to rapidly and accurately identify these emerging novel substances. However, laboratories are often unable to detect these NPS as they usually are not part of their existing panels monitored with targeted approaches. The use of high resolution accurate mass technology allows the recording of a complete digital data archive for any unknown sample at precursor and fragment levels, making it the ideal platform for simultaneous identification and quantitation of known and emerging novel psychoactive substances.
In this study, the analytical performance of a method for the screening and quantification of a panel of 54 NPS including synthetic cathinones, synthetic cannabinoids, benzodiazepines, and fentanyl analogs was evaluated using the SCIEX X500R TOF System. The performance of two different sample preparation techniques: (1) protein precipitation (PP) and salting-out liquid-liquid extraction (SALLE) was also compared.
Key features of SWATH Acquisition method for NPS identification and quantitation
- SWATH Acquisition is an MS acquisition technique that collects MS and MS/MS data on all detectable compounds in a sample, creating a digital record of the sample
- New analytes can be added to the analytical panel at any time without changing acquisition method
- Here, a NPS panel was tested consisting of 54 analytes, which include synthetic cannabinoids, cathinones, benzodiazepines and fentanyl analogs (Table 1)
- Two simple sample preparation approaches with excellent performance: PP and SALLE were evaluated and compared
- A 9.5-min LC method was developed using the ExionLC™ AC HPLC System for general screening and quantitation purpose
- Baseline separation of all critical isomers (fentanyl analogs) was achieved using an extended 17-min LC method
- Excellent sensitivity was demonstrated with limit of detection (LOD) between 0.1 and 1 ng/mL
- Great linear dynamic range (LDR) was shown with R2 values >0.995 for all analytes
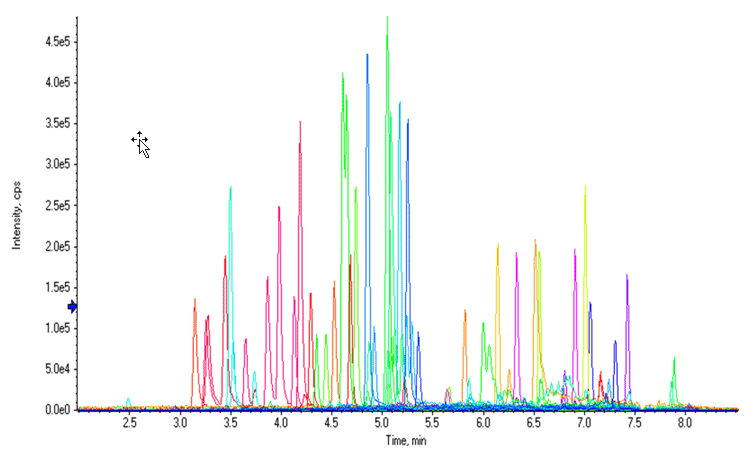
Figure 1: Chromatographic profile of the NPS panel by LC-MS analysis. Extracted Ion Chromatogram (XIC) resulting from total or near baseline separation of 54 compounds in a 9.5-minute runtime.
Experimental details
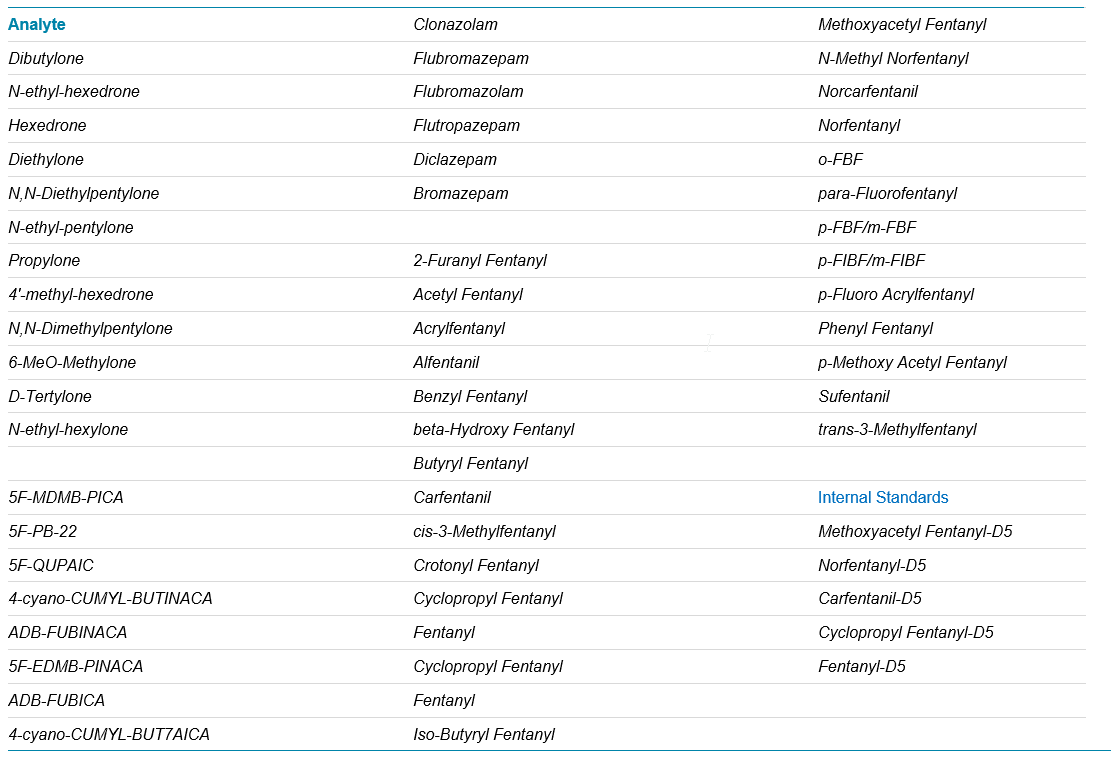
Samples: Human whole blood (K2 EDTA) samples were used in this study. The concentrations of the 54 NPS in the calibrators were 0.1, 0.2, 1, 2, 10, 50, and 200 ng/mL. Also prepared were 1 and 10 ng/mL in water to study matrix effects. Table 1 shows the list of these NPS and internal standards.
Protein precipitation: 100 µL of whole blood was spiked with various levels of analytes and internal standards, and 400 µL of cold acetonitrile were added. The sample was vigorously vortexed for 10 sec and centrifuged at 15,000 g for 5 min. 360 µL of the supernatant were transferred to a 2-mL Eppendorf tube and dried down under nitrogen. The sample was reconstituted in 144 µL of 80:20 water:methanol.
SALLE: 100 µL of whole blood was mixed with IS and 300 µL of saturated KCl solution. The sample was vortexed, and 3 mL of cold acetonitrile was added. After settling, 2 mL from the organic layer were transferred to a glass tube, dried under nitrogen, and reconstituted with 120 µL of 80:20 water:methanol.
Liquid chromatography: Two LC methods were performed usig the ExionLC™ AC HPLC System. The first method utilized is based on the separation conditions used for the vMethod Application for 664 forensic compounds1 and used a water/methanol gradient with ammonium formate/formic acid and a Phenomenex Kinetex 50 x 4.6 mm 2.6 µm Phenyl-Hexyl column (00B-4495-E0). The total LC runtime was 9.5 min. This was for general purpose screening/quantitation. The second method has a 17-min runtime with a Phenomenex Kinetex Polar C18 100 x 2.1 mm 2.6 µm column (00A-4462-AN). This method was specifically optimized for fentanyl analogs and based on a previously published method.2
Mass spectrometry: An X500R QTOF System was used in the analysis of all samples. Data acquisition was TOF-MS scan followed by SWATH Acquisition using variable window setup (12 windows covering mass range from 100 to 500 m/z), resulting in a final cycle time of 0.617 sec. Detailed method information can be downloaded from our community website.3 Data was acquired and processed with SCIEX OS Software 1.5.
Table 1. List of the 54 NPS and internal standards used in this workflow.
Fast method for screening and quantitation of 54 NPS
The separation conditions for the vMethod Application for 664 forensic compounds1 were initially used for this workflow. Excellent sensitivity, LDR performance, and adequate LC separation were observed for most compounds with the exception of a few fentanyl analog isobaric groups, whose LC separation could be further improved. Figure 1 shows an extracted ion chromatogram (XIC) for 54 NPS in a control whole blood sample using the separation conditions from the vMethod.
Two main components are required for confident identification and accurate quantitation using a high resolution accurate mass system: (1) A data acquisition method recording full precursor and fragment ion information (i.e. MS and MS/MS of all detectable species) without bias, and (2) A robust and versatile software that assists users with high resolution ion extraction, peak integration, isotope distribution pattern comparison, MS/MS spectra matching (to MS/MS database) and other functions into a seamless, intuitive, fast and one-step data processing procedure.
Regarding data acquisition, a variable window SWATH Acquisition method was used in the study. This method included a survey scan experiment (TOF-MS) followed by 12 different Q1 isolation windows for the MS/MS covering mass range from 100 to 500 m/z, where most of the analyte masses are found.
The precursor and fragment ion information were collected for everything in the sample and with a sufficient number of data points (across the LC peak) using the X500R QTOF system, thanks to a very fast data acquisition cycle time (~0.6 s).
For data processing, the user could rely on both precursor ion information (mass accuracy, RT, isotope distribution pattern difference) as well as fragment ion information (MS/MS spectra matching to database) in the acquired data. In addition, SCIEX OS software automatically computed scores for these parameters and combined these scores to generate an aggregate score (“Combined Score”) with customized weightings (Figure 2, left). Positive findings were determined with a combination of these performances as well as a minimum “Combined Score” of 30%.
Figure 2: Confidence Criteria Used for Data Processing Using SCIEX OS Software. Qualitative rules (left) and user-defined flexible combination of pass/fail filter (right) where all conditions should be met for positive identification.
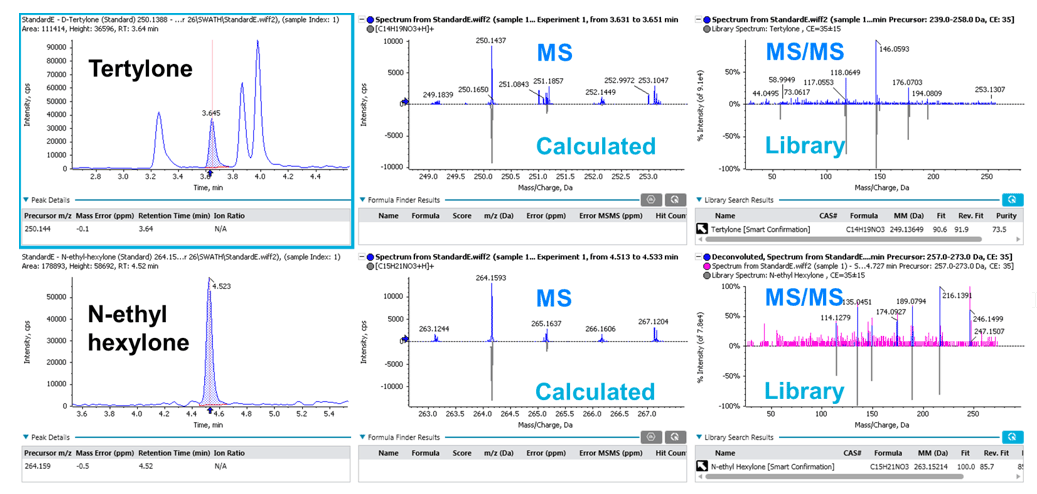
Figure 3 shows examples of XIC, MS spectra and MS/MS library match of tertylone and N-ethyl-hexylone at 2 ng/mL in whole blood as identified by SCIEX OS Software. The displayed XIC chromatograms and spectra help users visualize and quickly assess data quality, specifically the MS/MS library match performance.
Figure 3: Streamlined analyte identification and quantification using SCIEX OS Software. Visualization of identification performance for tertylone and N-ethyl hexylone at 2 ng/mL in whole blood using SCIEX OS Software. Both MS and MS/MS information are used in the compound identification and scoring.
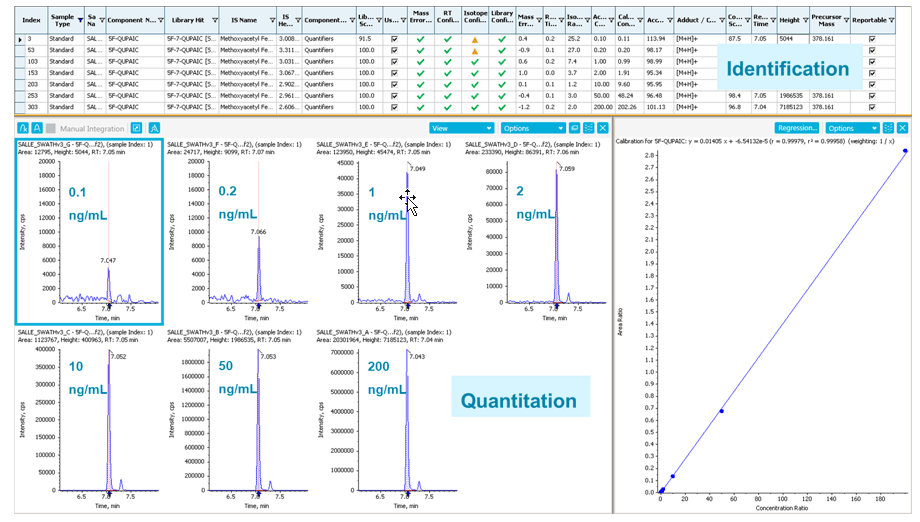
An example of simultaneous identification and quantitation of 5F-QUPAIC, a new synthetic cannabinoid, is shown in Figure 4. The identification parameters and performances are in the upper identification panel and include mass error, RT difference, isotope difference, MS/MS library matching score, etc. In the lower quantification panel, the XICs (based on accurate mass data) using 0.01 m/z mass extraction window are shown together with the linear-fitted calibration curve (0.1 to 200 ng/mL) with an R2 value of 0.99958.
The 9.5-min LC method allowed detection of groups of fentanyl analogs rather than individual analytes. These groups include (1) beta-hydroxy or p-methoxy acetyl fentanyl, (2) butyryl, isobutyryl, cis-methyl or trans-methyl fentanyl, (3) crotonyl or cyclopropyl fentanyl, and (4) fluorobutyryl and fluoroisobutyryl fentanyl in their o-, m-, and p- forms. Full separation and individual identification/quantitation of these fentanyl analogs was evaluated with a 17-min LC method, and is described later in this technote.
Figure 4: Accurate identification and reliable quantification of 5F-QUPAIC using SCIEX OS Software. Simultaneous identification and quantification of 5F-QUPAIC, showing the identification panel (top) and the quantitation panel (bottom) in SCIEX OS Software for full and thorough data review.
Limit of detection for the NPS panel
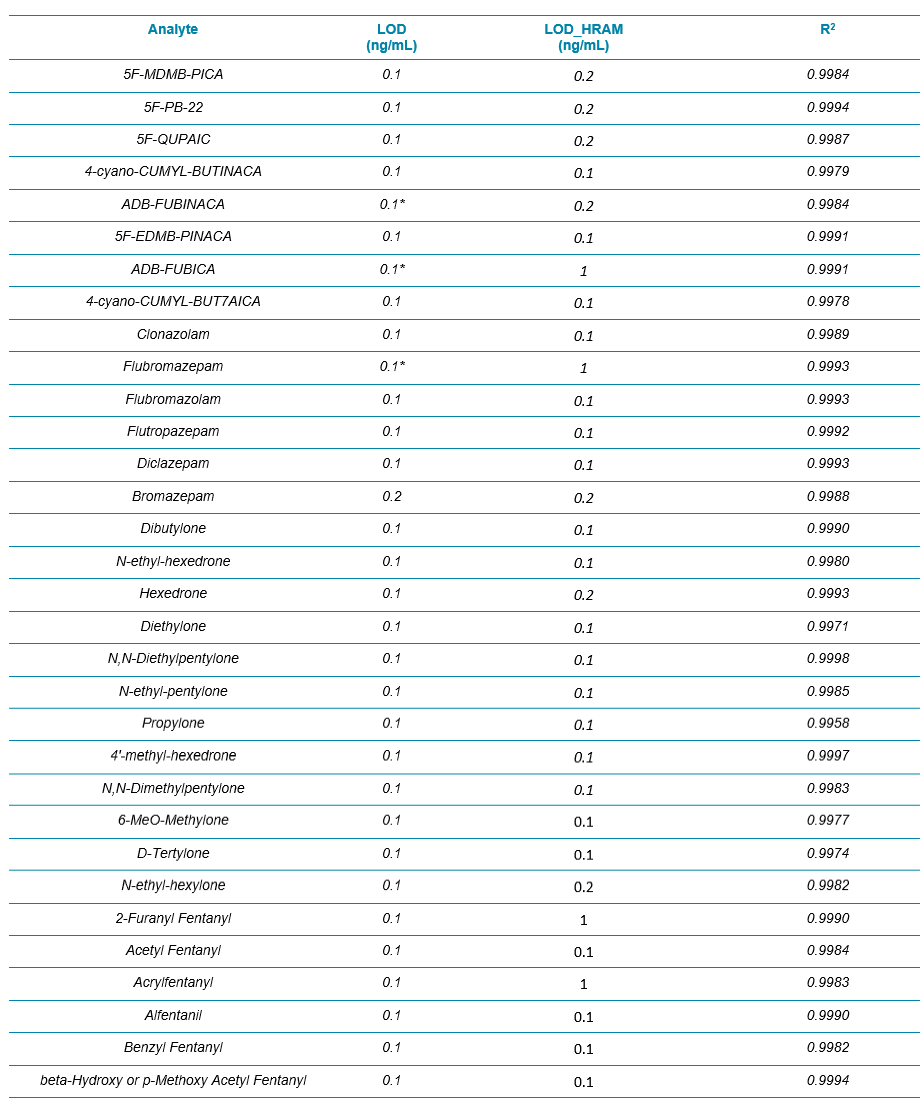
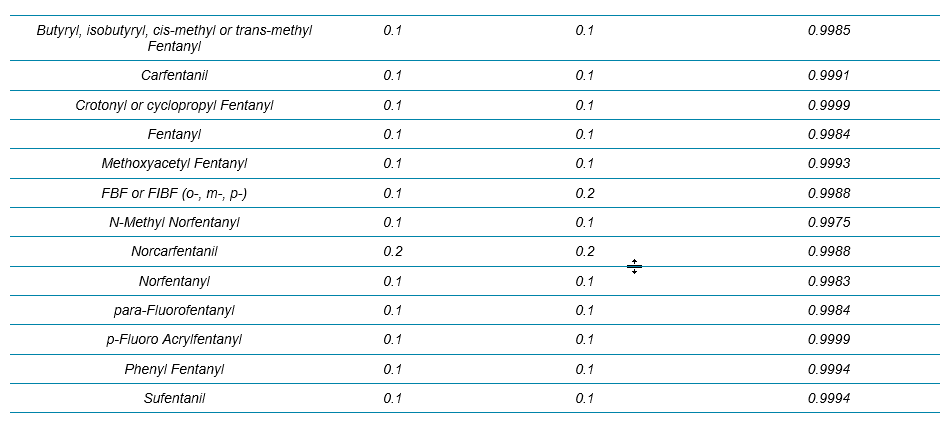
Table 2 summarizes the limit of detection (LOD) and the calibration curve R2 values from these 54 NPS. Overall, the LODs were around 0.1 ng/mL for all the analytes (based on accuracy and S/N of XICs) and the R2 values were mostly above 0.995 with mainly linear fit and 1/x weighting. Column “LOD_HRAM” represented a new set of LODs that utilized a more stringent set of criteria. LOD_HRAM level should further show mass accuracy better than 5 ppm, RT difference better than 5%, and a “Combined Score” better than 30% (Figure 2). These additional filters improved the level of confidence in identification. However, the user should ultimately use caution setting these filters as being either too stringent or too compromising would lead to either more false negatives or false positives, respectively.
Quantitation with fragment ion information
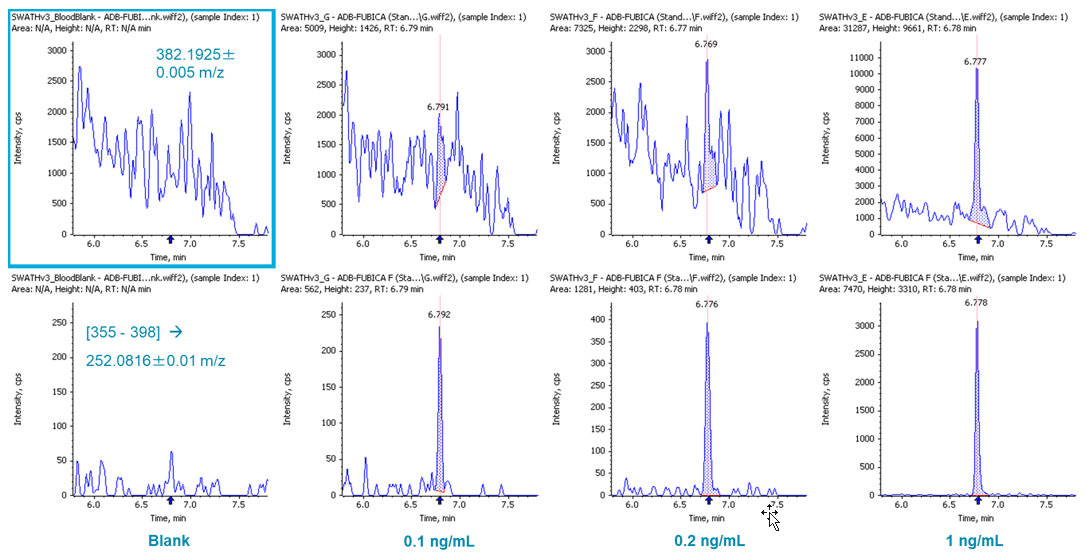
Performing quantitation using precursor ion information is usually sufficient when using high resolution accurate mass data. However, using fragment ion information can be helpful when the sample matrix is more complex (e.g. blood samples). SCIEX OS Software provides flexibility in the selection of either precursor or fragment ion for quantitation. Figure 5 demonstrates the quantitation performance of ADB-FUBICA, as an example. High background was observed when the precursor ion of ADB-FUBICA (382.1925±0.005 m/z, top row) was used for quantitation (LOD at 1 ng/mL). Use of the fragment ion 252.0816 m/z presented more sensitive detection ([355-398] -> 252.0816±0.005 m/z, bottom row) with the new LOD at 0.1 ng/mL, a 10-fold improvement by simply re-examining the data. A few other analytes also benefited significantly from this approach, such as ADB-FUBINACA and flubromazepam (data not shown).
Figure 5: Reliable quantitation using precursor (top) and fragment (bottom) ions. Quantitation of ADB-FUBICA with its precursor ion (382.1925±0.005 m/z, top row) and main fragment ion ([355-398] -> 252.0816±0.01 m/z, bottom row).
Protein precipitation (PP) vs. salting-out liquid-liquid extraction (SALLE)
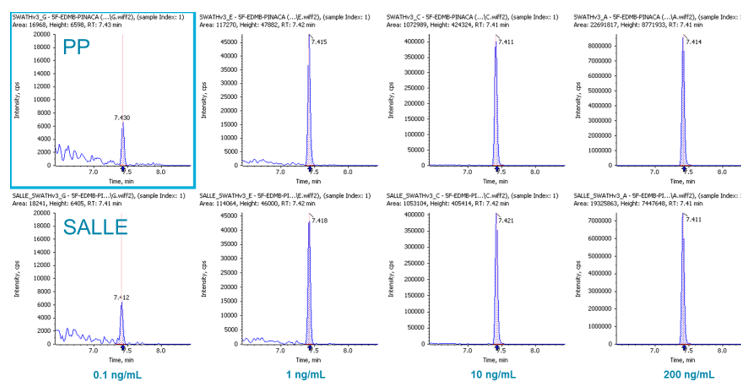
For blood samples, one of the most widely used sample preparation procedures is (PP) (followed by drying down and reconstitution). In this study, we not only tested PP but also a more novel procedure called SALLE. It has been observed that adding inorganic salt into a mixture of water and a water-miscible organic solvent causes phase separation. Using high salt concentrations in water and mixing with high polarity water-miscible organic solvents, extraction of many analytes can be achieved (into the otherwise inseparable organic layer), similar to traditional LLE. In this study, it was found that these two approaches performed very similarly for our application in terms of LOD, LDR, recovery etc. Figure 6 displays the signal comparison between PP and SALLE of 5F-EDMB-PINACA in whole blood at a few spiked concentrations, demonstrating the similarity in signal response between the two approaches.
Figure 6: Signal comparison between PP and SALLE. XICs for 5F-EDMB-PINACA for PP (top row) and SALLE (bottom row) at different concentrations in whole blood.
Longer method (17 minutes) leads to complete LC separation of fentanyl analogs
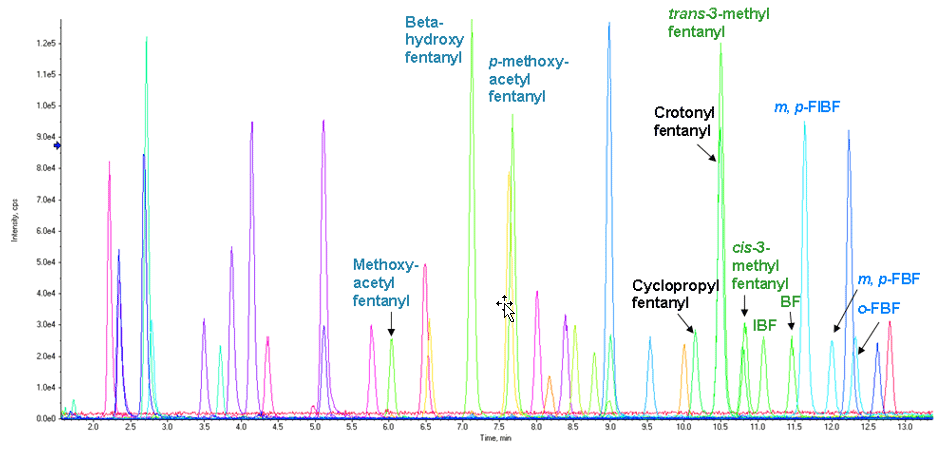
The 9.5-min LC method described earlier was a general-purpose gradient that is identical to the LC method provided in our vMethod for forensic screening of 664 drugs.1 With the presence of several new isobaric fentanyl analogs that had extremely similar structure (hence similar MS/MS fragmentation pattern), a longer method was needed for identification of the individual isobars. An LC method describing a quantitation method of fentanyl analogs with a 17-min LC method and a QTRAP® 4500 System2 was used here in combination with SWATH Acquisition. Figure 7 shows the XICs of synthetic cathinones, benzodiazepines, and fentanyl analogs at 2 ng/mL level (synthetic cannabinoids are not shown as this longer method was not intended for use with those highly hydrophobic analytes).
Matrix effect
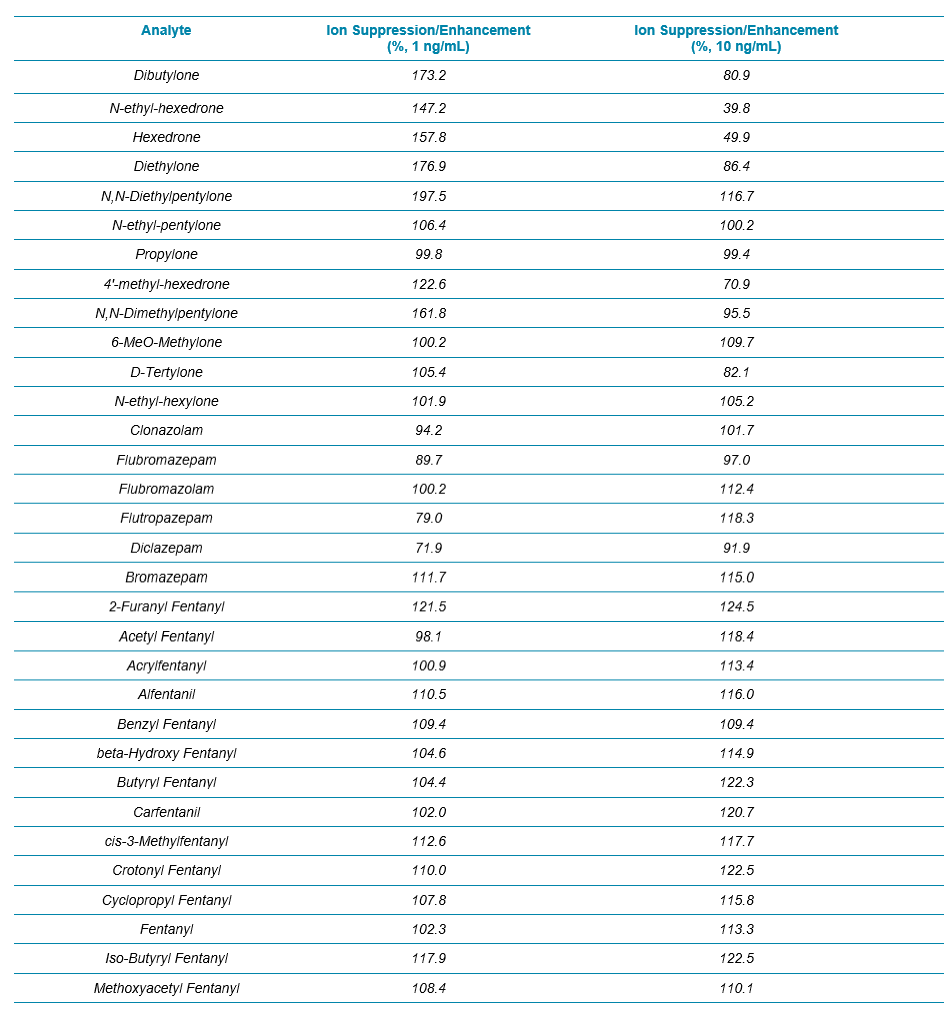
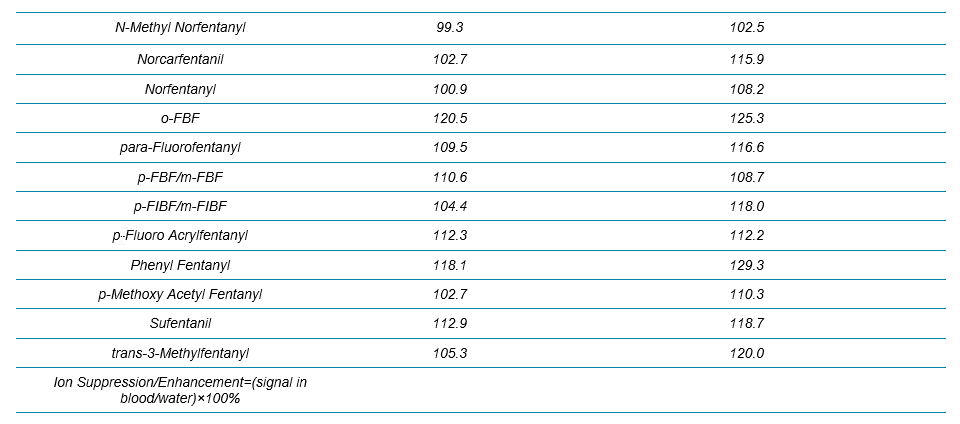
Two water samples were prepared by spiking analytes at 1 and 10 ng/mL, and the signals of all the analytes/internal standards were compared between the spiked water and blood samples. The results for all the analytes in the NPS panel are summarized in Table 3. Overall, except some enhancement observed for a few synthetic cathinones at 1 ng/mL, no significant ion suppression or enhancement was seen for any of the benzos and fentanyl analogs.
Variable window SWATH Acquisition for digital sample record generation
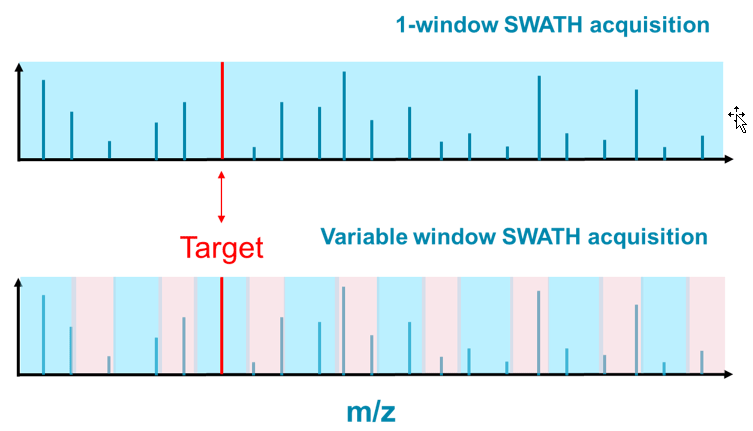
The limited ability to identify NPS has been plaguing the forensic community for years even with the introduction of high resolution accurate mass systems. SWATH Acquisition is a powerful LC-MS approach that allows users to record a digital archive for any unknown sample at both the MS and MS/MS level. In recent years, SWATH Acquisition has been proven to be a versatile workflow with adoption across many different applications. Figure 8 shows two examples of SWATH Acquisition methods. In the 1-window method, all the precursor ions were transmitted from Q1 to Q2, or the collision cell, for ion fragmentation: all ions at the same time. Though the MS/MS information was comprehensive, it was challenging to associate specific fragment ions to the corresponding precursor ion due to the high complexity of the MS/MS spectra resulting in lack of data specificity.
Figure 7. Longer LC gradient leads to baseline separation of fentanyl analogs. Chromatographic profile of the NPS panel by LC-MS analysis using the 17-min LC gradient (2 ng/mL).
Using the second approach, termed variable window SWATH Acquisition, the target mass range was divided into multiple windows varying in size, and the MS/MS information would be acquired for each in a sequential fashion. The resulted MS/MS information was not only comprehensive but significantly more specific compared to the 1-window approach. For the Target ion in Figure 8, one could safely expect that the MS/MS information from the variable window approach would be easier to interpret than the 1-window approach.
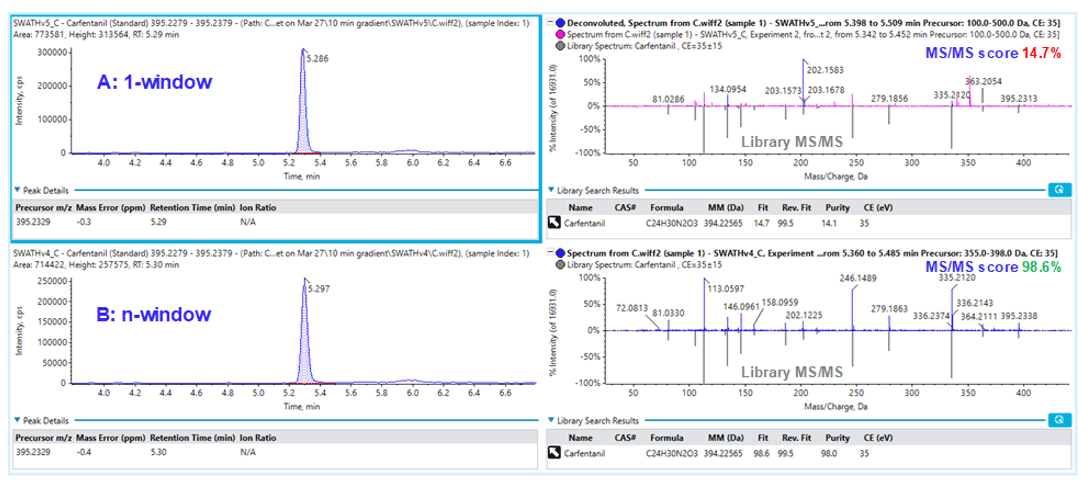
It was not surprising that the variable window SWATH Acquisition approach yielded much improved MS/MS matching scores between the unknown and MS/MS database for more accurate identification as shown in Figure 9 for the detection of carfentanil. The top row showed the XIC of carfentanil precursor ion (left) and the MS/MS matching with 1-window SWATH Acquisition method (right). One of the main fragments observed from 1-window method was at 202.1583 m/z and it was unclear what the precursor ion was, but this intense fragment ion dwarfed the actual fragment ions from carfentanil, causing the MS/MS matching to fail (matching score 14.7%), and would possibly render a false-negative finding. With the variable window approach shown in the bottom row, the MS/MS information for carfentanil was acquired in the Q1 window of 355-398 m/z and the MS/MS matching score was improved to 98.6%, which allowed correct identification of carfentanil. As the main 202.1583 m/z fragment ion seen in the 1-window approach is significantly reduced, it probably came from a precursor ion outside of 355-398 m/z window.
Overall, significant MS/MS matching improvement was observed for at least 10 analytes in the panel from using 1-window to variable window SWATH Acquisition. Therefore, it is not only important to acquire a digital archive for forensic samples using the MS/MSAll approach, but also to appreciate the significance in improving the data specificity by using variable-window SWATH Acquisition.
Figure 8: Impact of number of Q1 isolation windows when using SWATH Acquisition. One window SWATH Acquisition (top) uses 1 very large Q1 isolation window to select precursors for MS/MS, and therefore produces highly convolved MS/MS spectra of everything eluting off the column at that point in time. When using multiple variable-sized windows during SWATH Acquisition (bottom), many fewer precursors are selected due to the much narrower isolation window, leading to MS/MS spectra that is much simpler and therefore easier to interpret.
Figure 9: Improvement in library matching using variable window SWATH Acquisition. Library matching for carfentanil using (A) 1-window and (B) variable-window SWATH Acquisition.
Conclusions
The analytical performance of a screening and quantitation method for 54 NPS in whole blood was evaluated. LODs were determined to be in the range of 0.1-1 ng/mL for all the analytes. Successful analyte confirmation relied on mass accuracy, RT, MS/MS library matching and the associated combined score. Two sample preparation techniques were evaluated and compared: protein precipitation and SALLE. Both approaches yielded similar recovery. The unbiased nature of the SWATH Acquisition approach made this a poweful method to screen for NPS in forensic samples. In addition, the creation of the more specific digital record of the sample allows the sample to be analyzed for new NPS in the future.
References
- vMethod™ Application - Single-Injection Screening of 664 Forensic Toxicology Compounds on a SCIEX X500R QTOF System.
- Quantitative Analysis of Fentanyl and Analogues in Human Whole Blood. SCIEX technical note RUO-MKT-02-8322-A.
- Download Supplementary information.
Table 2. LOD and LDR Evaluation for the 54 NPS in Whole Blood with the Protein Precipitation Procedure and the 9.5 min LC Method Using Variable Window SWATH Acquisition. The LOD_HRAM column refers to the LOD determined based on qualitative rules defined by the acceptance criteria shown in Figure 2.
Table 2 Continued.
Table 3. Evaluation of Ion Suppression/Enhancement for the 54 NPS Using the 17 min Gradient Using Variable Window SWATH Acquisition.
Table 3 Continued.
 Click to enlarge
 Click to enlarge
 Click to enlarge
 Click to enlarge
 Click to enlarge
 Click to enlarge
 Click to enlarge
 Click to enlarge
 Click to enlarge
 Click to enlarge
 Click to enlarge
 Click to enlarge
 Click to enlarge
 Click to enlarge