Differential mobility separation for improving lipidomic analysis by mass spectrometry
SelexION® Technology on QTRAP® Systems
Paul RS Baker1, J. Larry Campbell2, Eva Duchoslav2 and Christie Hunter1
1SCIEX, USA; 2SCIEX, Canada
Abstract
Using ESI mass spectrometry to study lipids has been driving to higher throughput analysis but is hindered by the extensive isobaric overlap. SelexION® Technology is a planar differential mobility device (DMS) that separates lipids based on differences in their chemical properties, allowing separation of isobaric and isomeric lipid compounds. Use of chemical modifiers allows resolution of lipid classes and subclasses further enabling more confident identification of lipid molecular species and provides for more accurate relative quantitation by MS/MS.
Introduction
In recent years, the biochemical study of lipids has transformed from slow multi-dimensional chromatographic separations and chemical derivatization strategies to higher throughput analysis by mass spectrometry. Advances in mass spectrometry have enabled in-depth lipidomic analyses with unparalleled qualitative and quantitative sensitivity. However, unambiguous identification and quantitation of lipid molecular species in total lipid extracts has proven to be difficult, primarily due to isobaric overlapping isobaric and isomeric species. There are greater than 100,000 lipid molecular species present in a typical biological lipid extract that occupy a narrow mass range (~400-1100 amu), making such overlap a significant problem.
Herein, we present data demonstrating how differential mobility separation (DMS) using SelexION technology which effectively resolves multiple lipid classes from complex mixtures prior to analysis by mass spectrometry. By removing isobaric and isomeric interferences, lipid analysis by QTRAP® systems using SelexION technology enables more confident identification of lipid molecular species and provides for more accurate relative quantitation by MSMS.
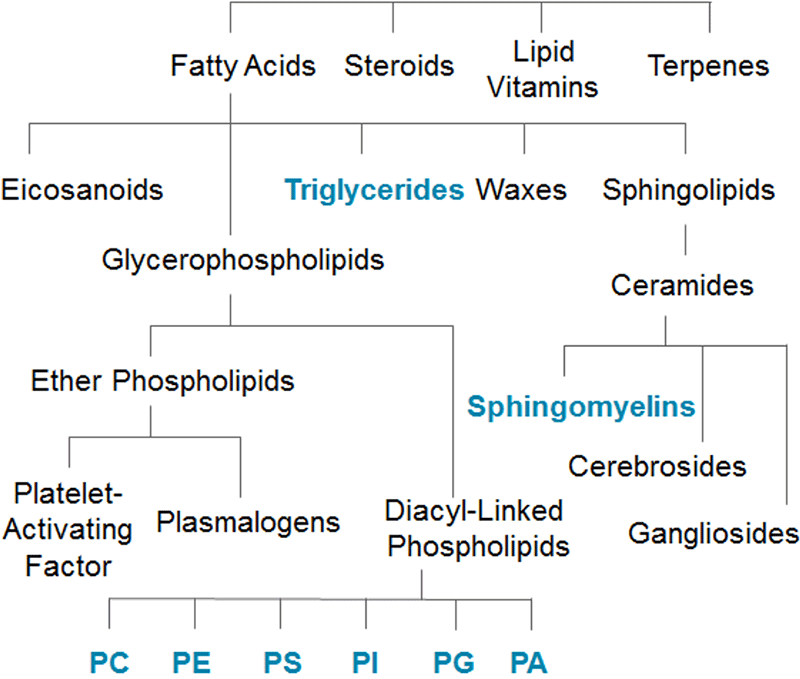
Figure 1. Complexity of the Lipidome. The lipidome is comprised of many structurally diverse classes and sub-classes. Considering there are over 100,000 different lipid molecular species in a narrow mass range, isobaric and isomeric overlap is a major problem in lipidomic analysis by mass spectrometry.
Key features of SelexION Technology for Lipid Analysis
- SelexION Technology is a planar differential mobility device (DMS) that separates analytes based on differences in their chemical properties, prior to entering the instrument orifice, thus providing an orthogonal level of selectivity.1,2
- Differential charge site topography makes phospholipids ideal candidates for differential mobility separation with SelexION Technology
- Ability to use chemical modifiers with SelexION Technology allows lipid classes and subclasses to be resolved
- Separation of isobaric and isomeric lipid compounds clarifies lipid identification and improves relative quantitation
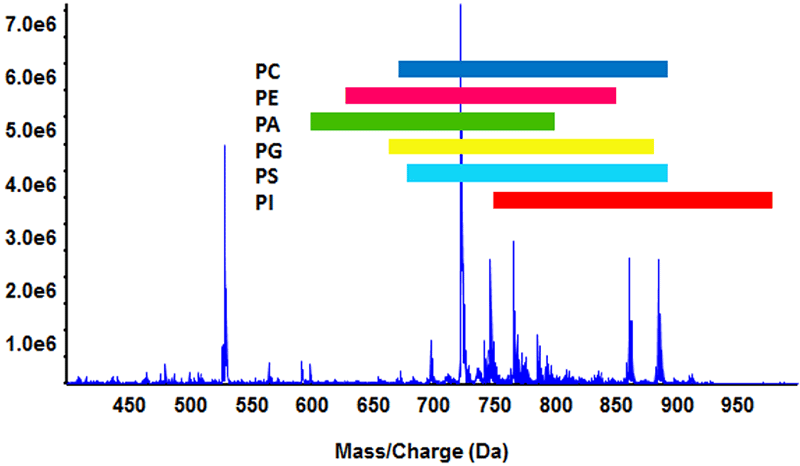
Figure 2. Isobaric overlap of phospholipids. In a complex lipid extract, the six major phospholipid sub-classes have extensive isobaric overlap as indicated by the colored bars (lysophospholipids were not considered). Some lipid molecular species are isomeric (same elemental composition) and cannot be resolved by accurate mass measurements alone. Traditional approaches to resolve these compounds include multiplexed precursor ion and neutral loss scans and extensive chromatography.
Methods
Sample preparation: Phospholipid standards (PC - 1-oleoyl-2-palmitoyl-sn-glycero-3-phosphocholine, PE -phosphoethanolamine, PS -phosphoserine, PG -phosphoglycerol, PI - and PA - phosphate) and bovine heart total lipid extract were obtained from Avanti Polar Lipids. Phospholipid standards (1 ng/mL each) and bovine heart extract (10 µg/mL) were dissolved in MeOH:CH2Cl2:H2O (45:45:10, v/v) containing 3 mM ammonium acetate (final concentration).
Mass spectrometry: Samples were analyzed using a QTRAP® 5500 System equipped with SelexION® Technology. Samples were infused at 10 µL/min using the Turbo V™ Source. Source and compound settings were optimized for general lipid analysis. DMS voltage settings for specific phospholipid classes were determined using purified standards. Isopropanol was used as a modifier solvent3. Low modifier composition and high resolution gas settings were used.
Data analysis: Qualitative data was processed by PeakView® Software and presented mostly as raw spectra. In some cases, the data are smoothed as indicated.
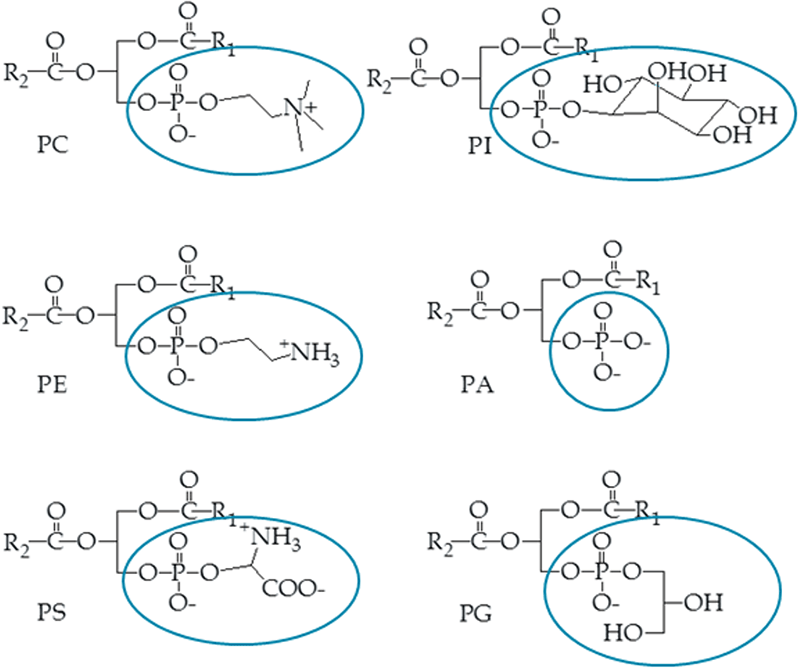
Figure 3. Phospholipid sub-classes. Phospholipid sub-classes are defined by their structurally unique head groups located at the sn-3 position of the glycerol backbone. Because the charge is located at these head groups, it was hypothesized that phospholipids would be ideal candidates for resolution by differential ion mobility separation.
Challenges of lipid analysis
Due to the complexity of the lipidome and the significant amount of isobaric and isomeric overlap, MS spectra often contain peaks and fragments from multiple compounds, making clear identification and relative quantitation of specific molecular species difficult. The prevalence of such overlap among the phospholipid subclasses is illustrated in Figure 2. All six subclasses overlap extensively, with isobaric species extending beyond Bhutto-type isomers to include molecular species of different phospholipid sub-classes. This interference has long been a challenge to shotgun lipidomic approaches by infusion. Traditional approaches to address isobaric overlap have included chromatography and fractionation; however, this approach is time consuming. Alternatively, multiplexed precursor ion and neutral loss experiments can use the power of the QTRAP® system’s targeted quadrupole scans to resolve individual sub-classes; however, subsequent MS/MS analysis to confirm molecular identities can still be complicated with isobaric overlap and result in ambiguous product ion spectra. None of the methods currently used to resolve isobaric overlap is ideal, and new approaches are needed, such as SelexION technology, to address this problem in lipidomic analysis.
The concept that DMS can effectively resolve lipids without time-consuming chromatography was spawned by the fact that SelexION Technology separates molecules based on the relative shapes and sizes of their charge sites. Because phospholipid sub-classes are defined by their unique polar head groups, which are the primary charge sites for these molecules (Figure 3), they appear to be ideal candidates for separation by DMS.
Figure 4. Phospholipid sub-class resolution by DMS. Six phospholipid standards were infused (1 ng/mL each) and analyzed in negative mode by a QTRAP 5500 System equipped with SelexION Technology using an MRM scan mode. The compensation voltage was ramped from -15 to 15 V to identify a unique CoV for each phospholipid sub-class. Baseline separation was achieved for all six sub-classes, suggesting DMS is a potential tool to separate complex biological lipid extracts.
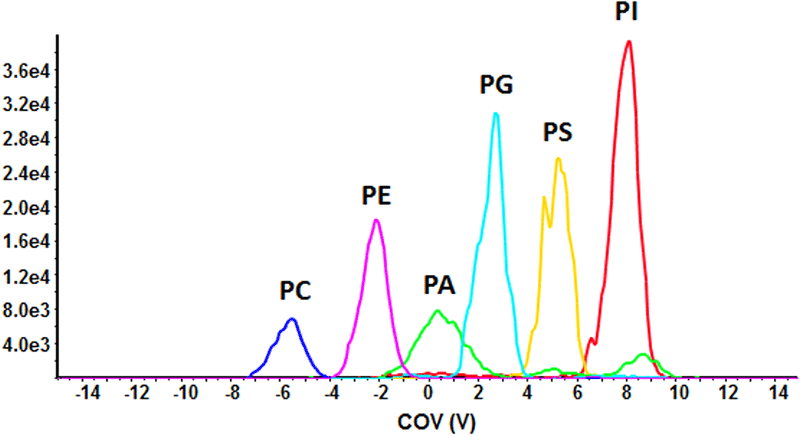
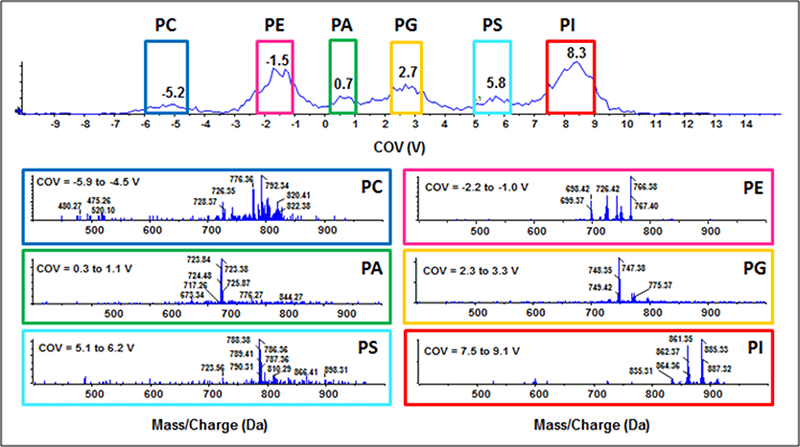
Figure 5. Resolution of phospholipid sub-classes in a complex lipid mixture. Bovine heart extract was infused into the mass spectrometer with the DMS on with high resolution gas. An MS ion trap scan mode was used (Enhanced MS) while the CoV was ramped as in Figure 4. Extracting each of the six peaks within the total ion chromatogram reveals a resolved spectrum for each phospholipid sub-class with nominal overlap. Unlike dedicated precursor ion or neutral loss scans, these identified precursors can be evaluated by MS/MS without cross contamination of isobars from other sub-classes.
Phospholipid sub-class separation by SelexION Technology
To assess the ability of DMS to resolve structurally distinct phospholipid sub-classes, a proof of concept experiment was designed using purified phospholipid standards (16:0,18:1-PC, -PE, -PA, -PG- PS and 16:0,16:0-PI; 1 ng/mL each). The lipid mixture was infused and ions were monitored by MRM analysis in the negative ion mode (Figure 4). The compensation voltage (CoV) was ramped during analysis to stabilize the trajectory of each PL subclass through the DMS cell. Using isopropanol as the chemical modifier and a separation voltage of 3800 V with high resolution gas, baseline separation of all six phospholipid sub-classes was achieved. The multiple peaks appearing for PA are Cl- and acetate-adducts that are dissociated post-DMS device; all other sub-classes appear as one resolved peak. Thus, DMS can be used to effectively resolve a simple mixture of phospholipids without prior chromatographic separation.
To test the ability of SelexION Technology to resolve a complex biological mixture of lipids, bovine heart extract (10 µg/mL) was analyzed using the QTRAP® 5500 system with SelexION technology. Using an ion trap MS scan (Enhanced MS) run with DMS off, the MS spectrum observed is complex with hundreds of lipid molecular species present (Figure 2). While the ion trap scan provides mass spectra of relatively low resolving power, even instruments with much higher resolving power could not resolve the isobaric and isomeric lipids in this complex spectrum.
Bovine heart extract was analyzed by EMS in the negative ion mode with the DMS engaged. The compensation voltage was ramped from -15V to 15V in about 1 minute, and the resulting total ion chromatogram (TIC) was extracted based on discrete CoV ranges (Figure 5, top) that correspond to the six observed peaks. The MS scan observed from each TIC peak shows a set of MS peaks that correspond to lipids for each of the phospholipid class confirming the class separation (Figure 5, bottom).
The compensation voltage ranges for each phospholipid sub-class are slightly wider than were determined using purified standards alone (Figure 4), which is consistent with the broad range of masses for each sub-class in the lipid extract. In data not shown, the CoV varies to a small extent with phospholipid fatty acid chain length and bond-type at the sn-1 position (i.e., ester vs. ether linkages). However, the maximum for each sub-class is consistent between the two experiments.
Figure 6. Enhanced product ion (EPI) analysis of precursor Ion m/z 786.4 form bovine heart extract. A product ion spectrum of m/z 786.4 was obtained from bovine heart extract in the negative ion mode. The DMS unit was attached to the instrument, but all voltages were set to zero (i.e., transparent mode) and no separation occurred in the DMS cell. Peaks consistent with the masses of multiple fatty acid anions were generated. The lack of specificity during MS/MS analysis makes it unclear as to the identity of the precursor ion. |
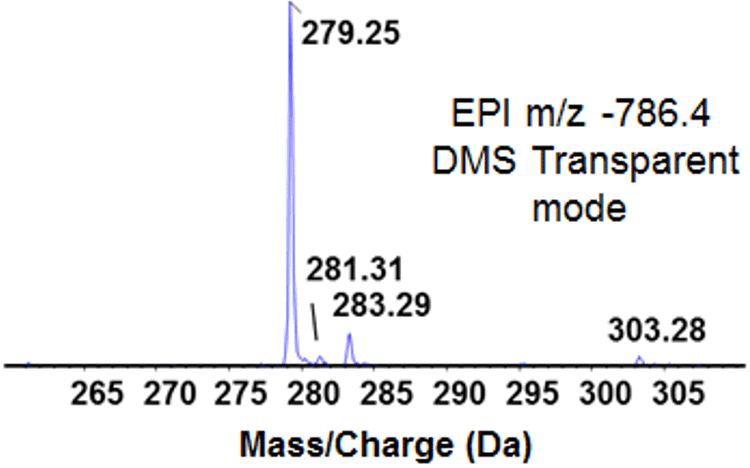
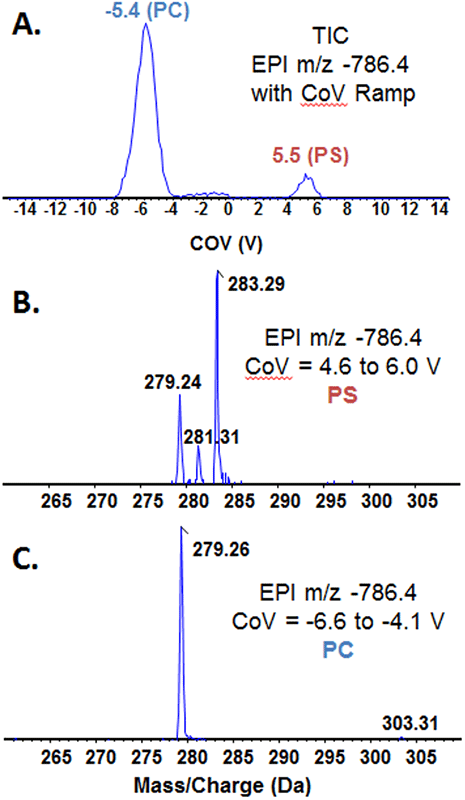
Figure 7. Use of DMS to reduce isobaric interference during product ion analysis. Product ion analysis was performed on bovine heart extract in the negative ion mode using DMS to resolve phospholipid subclasses prior to MS analysis. The COV was ramped from -15 to 15V, which generated two major peaks in the TIC (A). The peak CoV values are consistent with PS (5.5) and PC (-5.4). Extraction of each peak revealed the product ion spectra for PS (B) and PC (C) precursor ions. From these data, the precursor ion 786.4 corresponds to two isomers of PS 34:2 and an acetate adduct of the ether linked PC species PC 0-32:4.
Phospholipid sub-class separation improves lipid identification
The biggest challenge in shotgun-style lipidomics is interpretation of the large amount of data generated in each experiment. Clear, unambiguous product ion spectra will increase confidence in the results obtained using LipidView™ Software. With SelexION Technology, lipids can be resolved into their respective classes and subclasses prior to mass analysis, significantly reducing isobaric and isomeric overlap in the MS/MS spectra obtained for the different lipid classes and sub-classes.
Figure 6 presents the product ion spectrum obtained from the precursor ion m/z 786.4 (negative ion mode analysis). Apparent in the MS/MS spectrum are four predominant fatty acid anion fragments at nominal masses of 279, 281, 283 and 303 (linoleic, oleic, stearic and arachidonic acids, respectively). The mass calculator in LipidView Software reports 22 different possible identities for this precursor ion, so more information is needed to correctly identify the molecule. The ability of DMS to clarify ambiguous product ion spectra was tested by ramping the CoV during EPI analysis.
Figure 7A shows the TIC of the run, displaying predominant peaks at -5.4 V and +5.5V, peaks corresponding to PC and PS, respectively. There is a much smaller peak around -2 V, suggesting there may also be PE lipid molecular species with a precursor mass of 786.4. Figure 7B shows the spectrum obtained from averaging the MS/MS data from CoV 4.6 to 6.0 V. Three fatty acid anion fragments are present in the spectrum, including linoleic, oleic and stearic acids (m/z 279.24, 281.31 and 283.29, respectively) and the CoV value corresponds to PS. LipidView Software suggests the most likely precursor ion is PS 36:2 and MS/MS spectrum suggests two isomeric lipid molecular species: PS with two oleic acid moieties (two 18:1 fatty acids) and PS with one linoleic acid and one stearic acid (18:2 and 18:0).
For the spectrum in Figure 7C from CoV range -6.6 to -4.1 V, the species is PC and there is one clear fatty acid anion fragment, linoleic acid at m/z 279.26, and a smaller peak at m/z 303.31, corresponding to arachidonic acid (20:4). LipidView software calculator indicates 12 possible PC molecular species for this precursor mass; however, many have odd fatty acid chains, which are unlikely from a mammalian species. The appearance of just one major peak also suggests this particular species is likely an ether lipid (~50% of the phospholipids in bovine heart extract have an ether bond at the sn-1 position of the glycerol backbone). From these data, and considering the infusion solvent contains ammonium acetate, it is hypothesized that this PC lipid molecular species is the ammonium adduct of PC O-32:4.
Comparison of the product ion spectra for m/z 786.4 with (Figure 6) and without (Figure 7), DMS clearly demonstrates the power of this technique to help identify unknown lipid molecules. Lipid class separation with cleaner MS/MS spectra makes data processing more simple and effective.
Figure 8. Resolution of polar and neutral lipid classes by SelexION Technology. Bovine heart total lipid extract was infused and analyzed by EMS in the positive ion mode with the DMS engaged and the CoV ramped from -50V to +50 V. The dotted line on the TIC (A) delineates between polar and non-polar lipids as indicated. The extracted ion chromatogram for the polar lipids (B) and the neutral lipids (C) show good separation with minimal no crossover between the two spectra.
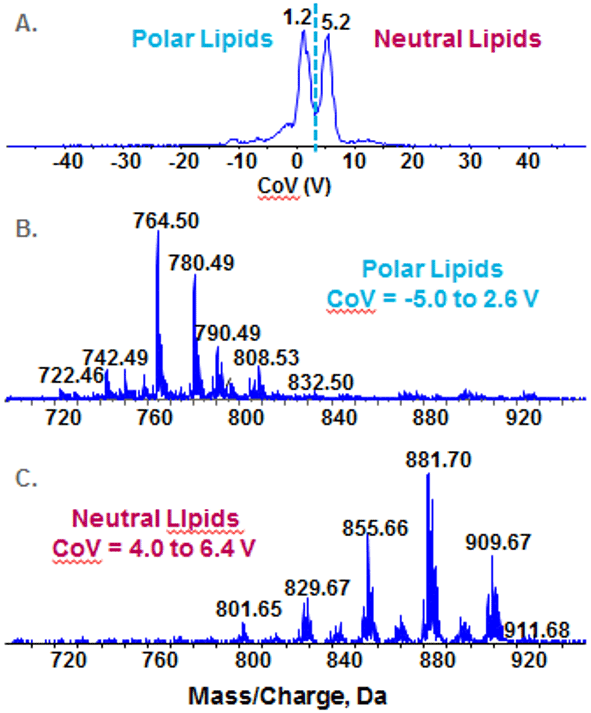
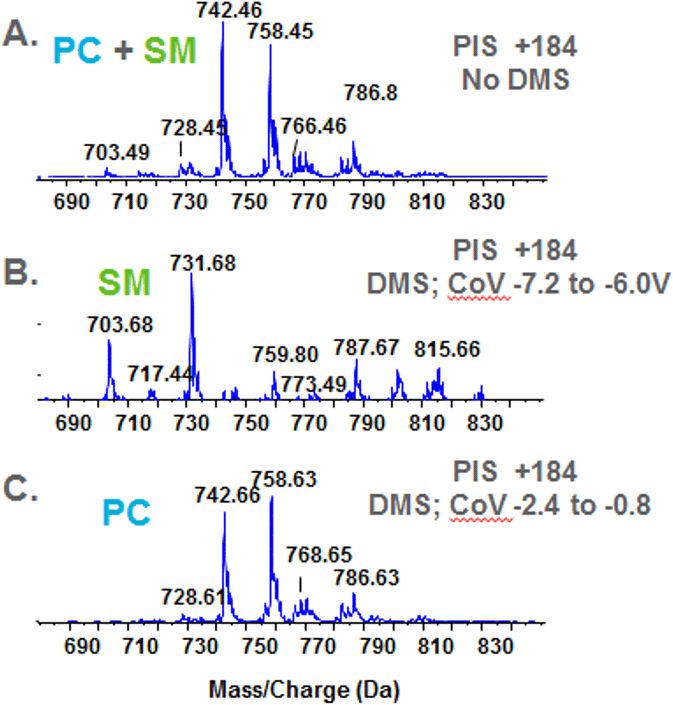
Figure 9. Resolution sphingomyelin and phosphatidylcholine during precursor ion analysis. Bovine heart extract was infused and analyzed by detecting molecules with a precursor ion of m/z 184 in the positive ion mode. Analysis performed without the DMS unit engaged gives a mixed spectrum of PC and SM—both classes have the phosphocholine fragment (A). Using the DMS to resolve the two classes generates two spectra: SM (B) and PC (C). The two classes are completely resolved form one another facilitating identification.
Resolution of different lipid classes using SelexION® Technology
In addition to phospholipids, the ability of DMS to resolve of other lipid classes was assessed. A total ion chromatogram (Figure 8A) in positive ion mode using the Enhanced MS scan on bovine heart extract shows two major peaks. The polar lipids (Figure 8B) are comprised primarily of phospholipids, sphingolipids and lysophospholipds, and the neutral lipids (Figure 8C) are comprised of tri-, di- and mono-acylglycerols and cholesterol esters. Note that there is minimal cross contamination, and subsequent product ion analysis will not suffer from isobaric overlap and contaminating fragment ions.
A traditional experiment used to isolate phosphatidylcholine (PC) in a complex lipid mixture is to perform precursor ion scans (PIS) dedicated to finding molecules with the common fragment associated with the phosphocholine head group (i.e., PIS +184); however, sphingomyelin (SM) species also have a phosphocholine moiety and will also appear in these spectra. Furthermore, the mass ranges of the two classes are nearly identical. Because SM molecules have two nitrogen atoms resulting in an odd mass, and PC has one nitrogen atom resulting in an even mass, the monoisotopic mass of one class will superimpose with the 13C ion of the other class.
Because of these challenges, differentiating between PC and SM and obtaining meaningful product ion spectra as a consequence of this isobaric overlap is very difficult. To clarify the data, bovine heart extract was analyzed in the precursor ion mode to acquire precursor ions of m/z +184 with and without the DMS engaged. Figure 9A shows the combined PC and SM spectrum that is normally be acquired during an infusion experiment on a triple quadrupole instrument. Figure 9B and C show the spectra of SM and PC that were obtained by resolving the two classes by DMS. Clear spectra are obtained and subsequent product ion analysis will generate cleaner product ion spectra for identification.
Conclusions
Lipidomics research has progressed rapidly in the last decade. Twenty years ago, the determination of the lipid composition of a biological sample required extensive chromatographic separation and chemical derivatization. Today, in-depth analysis can be performed quickly using ESI mass spectrometry.
SelexION Technology represents the next technological advance and is uniquely suited for lipidomic research. Using DMS as an upfront orthogonal separation enables the resolution of complex lipid mixtures, effectively addressing the problem of isobaric interferences among different lipid classes and sub-classes.
- Lipid classes can be resolved as they transmit the DMS cell, before they enter the mass spectrometer which enables cleaner MS and MS/MS data to be obtained. Separation by DMS of the lipid classes improves identification and quantification
- The planar design of the DMS cell enables the use of chemical modifiers to further increase the resolution of lipid species
- SelexION Technology can be used with either infusion or LC experiments
- Both positive and negative polarities are very useful for lipid analysis. Different ion types are produced depending on the polarity that is used, and these different ions can behave differently when using SelexION technology. We are working to better understand this phenomenon and exploit it further for lipid analysis.
References
- Schneider et al, (2010) Planar Differential Mobility Spectrometer as a Pre-Filter for Atmospheric Pressure Ionization mass Spectrometry, Int. J. Mass Spectrom., 298 (1-3), 45-54.
- SelexION® Technology: A New Solution to Selectivity Challenges in Quantitative Bioanalysis - Differential Mobility Separations Enhanced with Chemical Modifiers: A New Dimension in Selectivity. SCIEX Technical Note, Publication RUO-MKT-02-3251-A.
- Schneider BB, Covey TR, Coy SL, Krylov EV, Nazarov EG. (2010) Chemical effects in the separation process of a differential mobility/mass spectrometer system. Anal. Chem. 82, 1867-1880.
Related content
- Differential ion mobility separation of glycosylceramides (cerebrosides), SCIEX technical note RUO-MKT-02-1868-B.
- Differential mobility spectrometry resolves chlorine- and acetate-adducts of phosphatidylcholine (PC). SCIEX technical note RUO-MKT-02-4916-B.
- Resolution of ether- and diacyl-linked phospholipids by differential ion mobility spectrometry (DMS). SCIEX technical note RUO-MKT-02-1870-A.
- Differential ion mobility separation of iso-elemental lipid species. SCIEX technical note RUO-MKT-02-1869-A.
- Quantitative lipid analysis using MRM and differential ion mobility spectrometry. SCIEX technical note RUO-MKT-02-1871-A.
- Resolution of sphingomyelins in complex lipid extracts by differential ion mobility spectrometry (DMS). SCIEX technical note RUO-MKT-02-1867-A.
- Separation of bile acid isomers with differential mobility spectrometry. SCIEX technical note RUO-MKT-02-8566-A.
- Sensitive and accurate quantitation of retinoic acid isomers in biological samples. SCIEX technical note RUO-MKT-02-2254-A.
- Differential mobility separation enhances the quantification of lysophosphatidic acid in plasma. SCIEX technical note RUO-MKT-02-9274-A.