Enabling Systems Biology Driven Proteome Wide Quantitation of Mycobacterium Tuberculosis
SWATH® Acquisition on the TripleTOF® 5600+ System
Samuel L. Bader, Robert L. Moritz
Institute of Systems Biology, USA
Introduction
Systems biology focuses on elucidating the complex interactions within biological systems and studies how networks perform and manage their many biological functions. The ability to quantitatively monitor the majority of components of protein networks provides insight into the dynamical changes within the network at the molecular level to understand the system and how they are perturbed in disease. SWATH Acquisition is a key workflow to enable systems biology research as it can uniquely provide comprehensive high quality quantitation on a very large number of peptides and their inferred proteins.1 As the assays are predefined, the reproducibility is high and can be used to provide a very detailed view of the proteome dynamics in the biological system under investigation.
Tuberculosis is caused by the bacterium Mycobacterium tuberculosis (Mtb) and induces a chronic infection with high morbidity and mortality worldwide. In this work, Mtb is under investigation as new drugs and clinic-free diagnostics are desperately needed to address this disease caused by this highly prevalent pathogen. The pattern of proteome expression across the Mtb organism’s lifecycle will provide fundamental information for the study of the organisms life cycle and possible modes of disease progression and intervention.
A comprehensive spectral ion library has been developed for the M. tuberculosis proteome (www.srmatlas.org/mtb/swath.php) and is used for interrogating the SWATH Acquisition data.2,3
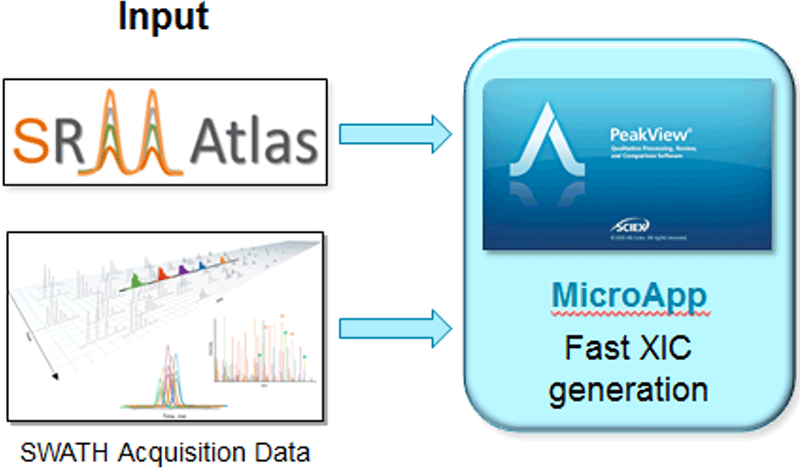
Figure 1. Workflow diagram. In-depth ion libraries with representative MS/MS spectra have been created for the M. tuberculosis pathogen. These are used to interrogate SWATH Acquisition data in the SWATH Acquisition MicroApp, enabling the comprehensive extraction of quantitative data from many peptides and protein across multiple samples.
Key steps for targeted quantitation using SWATH® Acquisition
- SWATH Acquisition on the TripleTOF® 5600+ System
- Full scan MS/MS of all detectable ions is acquired, enabling post-acquisition interrogation of data
- No upfront assay development is required
- Comprehensive high quality quantification with confirmation of identity on every detectable protein and peptide
- Targeted data extraction post-acquisition ensures reproducible detection of peptides and proteins across multiple samples
- In-depth ion libraries have been created to provide high proteome coverage for quantitation of these lower organisms and are available from the SWATHAtlas website3
Methods
Sample preparation: M. tuberculosis was grown under BSL3 laboratory conditions and harvested at three time points, early exponential phase, late exponential phase and stationary phase (Figure 4). Each sample was analyzed in technical triplicates.
Chromatography: The samples were analyzed using the NanoLC™ 425 System (SCIEX) coupled to a 15 cm analytical column (75 µm ID, packed in-house with Magic C18 AQ 5 µm diameter, 200 Å pore size, Michrom BioResources). Peptides were separated using a linear gradient from 2 – 35% B over 180 min at a flow rate of 300 nL/min (A – 2% acetonitrile in 0.1% formic acid, B – 98% acetonitrile in 0.1% formic acid).
Mass spectrometry: Eluant from the column was analyzed using the Nanospray® Ion Source on a TripleTOF® 5600+ System (SCIEX). The acquisition method was an SWATH® Acquisition method, where Q1 was stepped across a mass range of 400-1200 m/z and MS/MS was acquired from 100-2000 m/z. Q1 transmission windows were 25 Da wide and 32 steps were used with a 100 msec accumulation time on each, resulting in a total cycle time of 3.5 sec.
Data processing: Using a comprehensive spectral ion library generated for Mtb (Figure 2), the SWATH Acquisition data was processed using the SWATH Acquisition MicroApp 2.0 beta in PeakView® Software. Peptide and protein peak areas were exported to MarkerView™ Software for results interrogation. Principal component analysis (PCA) and principle component variable grouping (PCVG) were used to analyze differences.
Figure 2. Building consensus spectral libraries for use with SWATH Acquisition data processing. MS/MS spectra are collected on a large population of synthetic peptides that have been created to cover all proteins in a proteome. Multiple spectra of same precursor are then assessed to create a high quality MS/MS spectrum of every peptide, which contains additional intensity and retention time information (top). This library is then used during processing of SWATH Acquisition data for quantitation and confirmation of peptides and proteins (bottom).

M. tuberculosis Spectral Library
The analysis of SWATH Acquisition data requires the precise knowledge of the peptide fragmentation and chromatographic coordinates. These coordinates can be extracted from spectral libraries that consist of a high quality peptide MS/MS spectra obtained by consolidating multiple fragmentation spectra from many data dependent analysis. These spectral libraries contain both fragment intensity information for selected fragment ions and a standardized retention time (Figure 2) that is used when interrogating the SWATH Acquisition data. Such a complete proteome spectral library is available for M. tuberculosis2. In short, this library was generated using 13,007 unique synthetic proteotypic peptides mapping to 3,838 proteins (96% of the annotated proteome) covering all functional categories (Figure 3). Typically, six fragment ions per peptide are used when interrogating the SWATH Acquisition data, and in this case all peptides per protein contained in the library.
Figure 3. Coverage of M. tuberculosis proteome. 96% of proteins in the M. tuberculosis proteome are represented in the spectral library, with most of them having 2 or more peptides per protein (top). Most of the functional classes of proteins have good coverage in the spectral library, with an exception of the Pro-Glu (PE) and Pro-Pro-Glu (PPE) class of membrane proteins (bottom). This class of proteins is difficult to cover as the peptides tend to have high pH and hydrophobicity, and therefore only 70% of these proteins are covered by the library.

Changes in protein expression at different points in growth curve
In order to show that SWATH Acquisition allows quantitative profiling of an entire biological system, we monitored the protein abundance changes between three discrete time points along the growth curve. Samples were collected at early exponential, late exponential and stationary growth phase, lysed and digested with trypsin and then analyzed by three technical replicates. From the SWATH Acquisition data, targeted and reproducible chromatographic traces were extracted for over 5,100 peptides covering in total 2,805 proteins (73% of the proteome) (Figure 4).
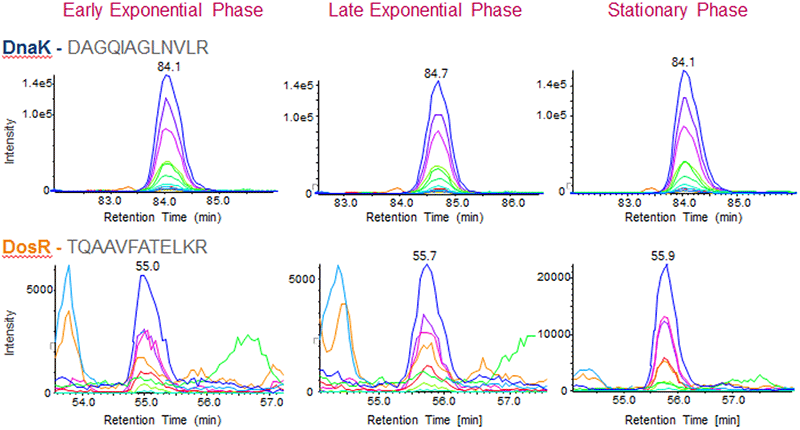
The growth of Mtb is well established and proteins such as those from the dosR regulon are known to change in abundance in stationary phase. Verification of the peptides derived from the transcription factor DosR (Rv3133c), which is known to increase in abundance in stationary phase, showed that we could reproduce these well-studied protein changes (Figure 5, bottom). As a control, five house-keeping proteins (DnaK, Enolase, Glycerol-3-phosphate dehydrogenase, GroEL and the DNA-directed RNA polymerase subunit beta) that were quantified in the dataset were analyzed and the abundance of each of these proteins remained unchanged as expected. To illustrate this result, the SWATH Acquisition data for a peptide from the control protein DnaK (DAGQIAGLNVLR, top) and a peptide for DosR (TQAAVFATELKR, bottom) are shown in Figure 5.
Figure 4. Proteins quantified in the different stages of growth. The sampling of the M. tuberculosis growth curve is illustrated (top). The spectral library contained 3838 proteins, 96% of the annotated proteome. The spectral library contained on average 3.4 peptides per protein and all peptides in library were extracted from the SWATH Acquisition data. Only peptides with a 1% FDR or better were used for quantitation. This resulted in ~5000 peptides and ~2400 proteins quantified in each experimental condition, ~63% of the targeted proteome.
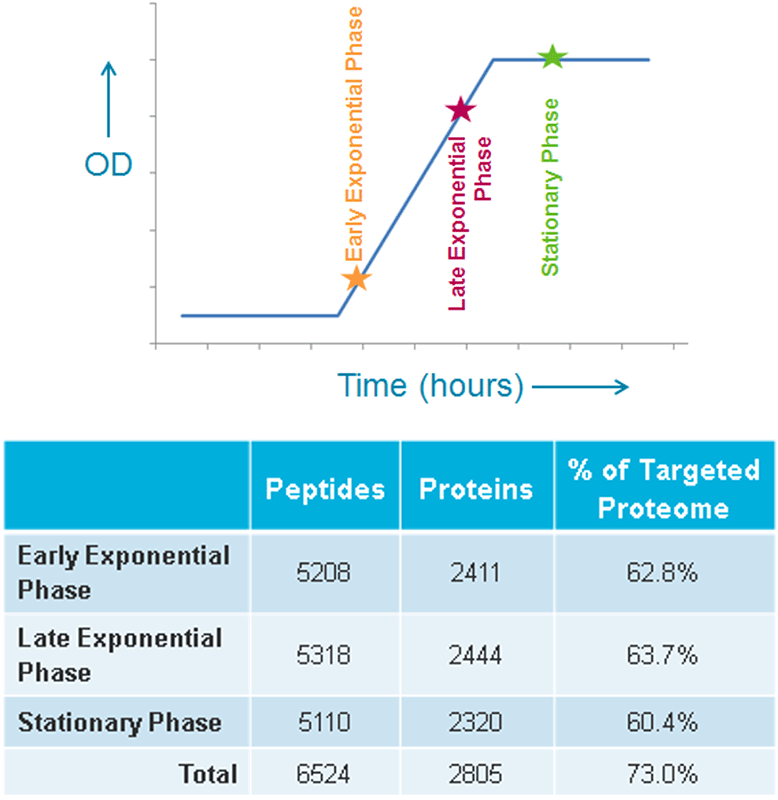
Figure 5. Visualizing the SWATH Acquisition data. Quantitative information is obtained by generating extracted ion chromatograms (XICs) of peptide fragment ions to the target proteins and then these XIC peak areas can be summed to obtain total protein areas for comparison across samples. Shown here are the XICs for peptide DAGQIAGLNVLR from the Mtb house-keeping protein DnaK (Rv0350) that was found to be unchanged across the 3 growth conditions (top). However the XICs for peptide TQAAVFATELKR from the Mtb protein DosR (Rv3133c) was found to be significantly up-regulated in stationary phase (bottom) as expected. |
To investigate the quantitative changes of the M. tuberculosis proteome along the growth curve, we exported the data from SWATH Acquisition MicroApp 2.0 beta to the MarkerView™ Software for statistical analysis and data visualization. This can be done at both the peptide and protein levels, using the sum of the fragment ion XIC peak areas for quantitation. In this case, the protein level data, inferred from the peptide level data, was analyzed as changes in overall protein expression were of most interest for the current investigation.
Principal component analysis (PCA) of the protein intensities could clearly separate the three growth conditions, and the close proximity of the technical replicates showed good reproducibility (Scores plot not shown). Then principle component variable grouping (PCVG) was used to group the proteins together that have a similar behavior (Figure 6, top).
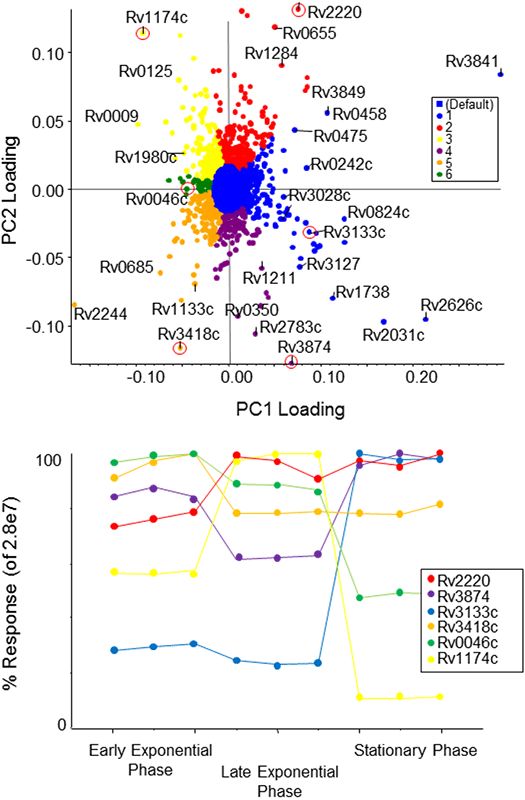
Figure 6. Quantitative profiling of proteins across the M. Tuberculosis growth curve. Using MarkerView™ Software, PCA analysis was used to determine which proteins were different between the different growth states, the loadings plot is shown on top. PCVG was then performed to determine which proteins had similar behavior, as shown by the colors (top). Representative proteins (circled in red) from each PCVG group were selected and the protein pattern was extracted to illustrate the protein expression changes (bottom).
DosR regulon
As a major human pathogen, Mtb has evolved survival mechanisms that allow it to evade the immune response and persist in a host in a dormant condition. The dormancy survival regulon (DosR Regulon) consists of 49 genes, believed to have a major role in dormancy. The DosR transcription factor (Rv3133c) targets this regulon and is well analyzed at the transcriptome level as it is thought to be involved in the dormant stage during latent tuberculosis.
As mentioned, the DosR transcription factor was quantified and confirmed to be up-regulated in stationary phase (blue group 1, Figure 6). There were 14 other proteins found in group 1 that showed this very similar up-regulation and are known targets of DosR (Figure 7).
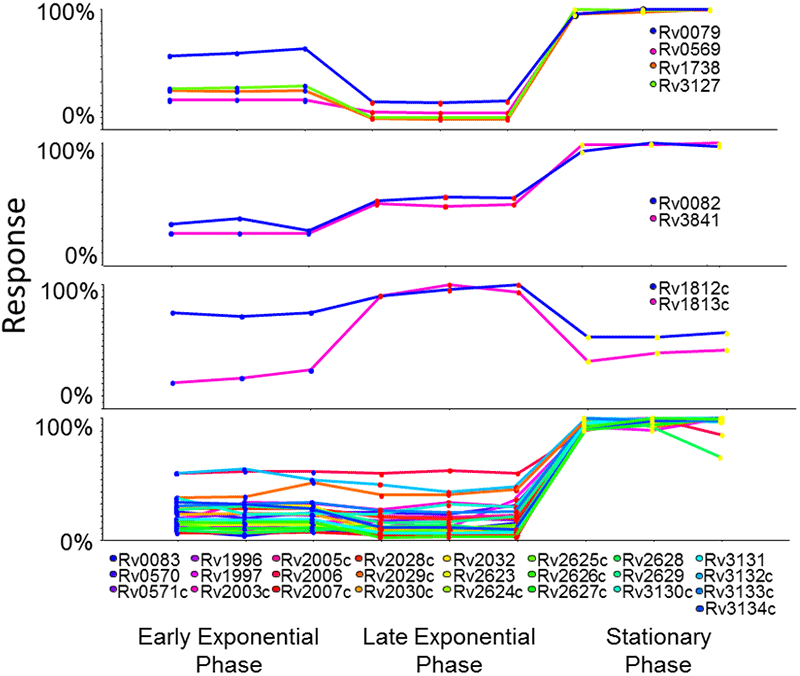
Of the 49 genes in the DosR regulon, 33 of these proteins were quantified in this study (Figure 8). As expected, the quantitative profiles of the majority of the dosR targets show a higher abundance in the stationary phase over the other points in the growth curve. Some proteins however were found to have different expression patterns as show in Figure 8.
After PCVG analysis, the similarly clustered proteins appear on the Loadings plot with the same color (Figure 6, top). This simplifies exploration of the various protein behaviors; a representative protein out of each color group was selected (bottom). The blue protein selected is transcription factor dosR (Rv3133c), found up-regulated in stationary phase. In contrast, the green protein inositol 1-phosphate synthetase (Rv0046c) was found to decrease in abundance towards stationary phase. The purple and yellow clusters exhibit opposite expression patterns to each other, with yellow showing increased in late exponential phase and purple showing decreased expression.
Figure 7. Confirming results using known behavior of the DosR regulon. The protein profiles for a number of the proteins belonging to the PCVG group 1 (blue, Figure 6) were extracted. Of these, 14 proteins are known targets of the transcription factor DosR (Rv3133c) and are known to show increased abundance in stationary phase, validating the quantitation results obtained in this experiment. |
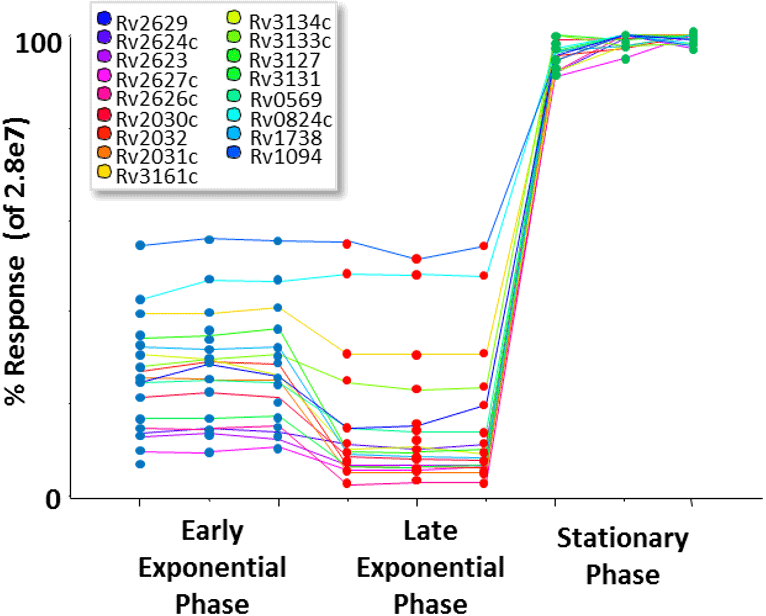
Figure 8. Abundance changes of 33 DosR target proteins. The quantitative profiles of all significantly identified dosR targets show a clear trend towards a high relative abundance in stationary phase. However, some proteins do show altered expression patterns. Note that for visualization purposes, the abundance changes per protein are plotted on a % scale where the highest signal of that protein across samples is 100%. |
Conclusions
SWATH Acquisition, a data independent acquisition strategy, provides a comprehensive analysis of complex proteomes, providing reproducible high quality quantitation on large numbers of peptides and proteins. Using a proteome wide spectral library for M. tuberculosis with SWATH Acquisition enabled us to quantify the effects of the DosR transcription factor on its target proteins at the protein level as and across the whole proteome in a single injection analysis.
- Data is interrogated using qualified spectral ion libraries, which are libraries of peptide MS/MS spectra and known retention times. Peptides are detected and extracted ion chromatograms of the fragment ions are generated for quantitation
- Publically available well-characterized whole organism spectral libraries are becoming increasingly3 available to provide very deep analysis of the proteome with SWATH Acquisition
- The high quality quantitative information obtained is both specific and reproducible sample to sample, enabling detailed information about protein abundance to be measured and understanding of protein regulation to be expanded.
References
- Gillet LC et al (2012) Mol. Cell. Prot. 11, 1-17.
- Schubert O et al. (2013) Cell Host and Microbe, 13(5):602-12.
- Mtb Library download at SWATHAtlas website.