ProteinPilot™ Software overview
High quality, in-depth protein identification and protein expression analysis
Sean L. Seymour and Christie L. Hunter
SCIEX, USA

Introduction
As mass spectrometers for quantitative proteomics experiments continue to get more sensitive, faster, and provide higher resolution data, there is an increasing requirement for the continued enhancement of bioinformatics resources to make meaningful sense of the massive amounts of mass spectrometry data and provide confident, consistent and reliable results.
ProteinPilot Software has changed the paradigm of protein identification and relative protein expression analysis for protein research by combining ease of use with sophisticated algorithms, to bring expert results to both informatics specialists and non-specialists alike. The software provides an intuitive user interface to combine the revolutionary Paragon™ Algorithm for deep sample interrogation with the rigorous Pro Group™ Algorithm for confident protein assignment. Also embedded are protein expression analysis tools for many different types of labeled based strategies including iTRAQ® Reagents and SILAC workflows. In the new era of tighter data scrutiny and the increasing amounts of data being produced, the advanced processing tools and confidence of results produced by ProteinPilot Software make it is an important and valuable tool for today’s proteomics researchers.
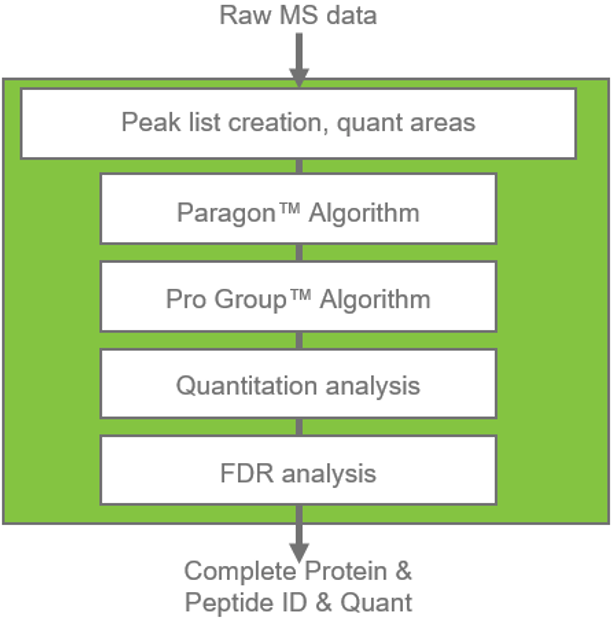
Figure 1. Overview of ProteinPilot Software workflow. From raw LC-MS/MS data, the software provides a streamlined processing path from raw data to full search results. First the Paragon Database Search Algorithm identifies peptides from MS/MS spectra, then the Pro Group Algorithm assembles peptide identifications into a list of reliable protein identifications. Depending on the experiment, quantitative analysis is performed. FDR analysis provides a confidence assessment of the results and a report is generated for all the protein/peptide identification and quantitation results.
Key features of ProteinPilot Software
- Paragon Algorithm allows hundreds of modifications and substitutions to be searched for simultaneously using its unique hybrid algorithm, combining database searching with a novel sequence tag search method.1
- Pro Group Algorithm determines with clarity how many proteins have been detected, reporting ambiguity among accession numbers to improve meaningfulness in the comparison of results.
- Unique search method user interface controls the search in terms of what was done at the lab bench, which is then translated into algorithmic settings, ensuring every user can obtain the highest quality results. Advanced users can further refine complex searches by interacting with this translation layer.
- Integrated false discovery rate (FDR) analysis provides a detailed FDR report accompanying every search for accurate assessment of the reliability of results.2
- Protein expression analysis can be also integrated into the processing, supporting many different label-based strategies.
- Search results can be interrogated in greater depth using the advanced data analysis tools provided with the software.
- Processes data from any vendor’s mass spectrometer using generic peak lists.
Innovative Paragon Algorithm
The Paragon Algorithm is an innovative technology that changes the paradigm for protein identification. The Paragon Algorithm is actually a hybrid between classical database search and a novel sequence tag approach. The use of the sequence tags is the key to doing a better job of determining which peptides are worth scoring, both improving thoroughness and reducing search time.
Sequence tags are essentially partial sequence interpretations of a peptide MS/MS spectrum. The Paragon Algorithm does this for each spectrum, automatically generating a very large number of these small sequence tags or ‘taglets’, and rates how likely each one is to be correct (Figure 2, left). To figure out which areas of the protein database are more likely to contain the right answer for the spectrum of interest, the taglets are mapped over the database. The sequence region most closely associated with the true answer should have a large number of confidently assigned taglets. This net effect of taglets is quantified in a measure called Sequence Temperature Value (STV), which is computed for each 7-residue segment (Figure 2, right).
Once the STVs have been determined throughout the search space, Paragon Algorithm uses knowledge of the probabilities of features and the user provided information about the sample, to limit very extensive searching only to those regions in the database associated with a large amount of implicating tag evidence. This is what enables the algorithm to simultaneously search for hundreds of features (modifications, substitutions, and unexpected cleavages) without the concomitant increase in false positives. Note that the majority of the time, the algorithm is not searching for all of these features. The Paragon Algorithm uniquely recognizes that modifications, even unexpected ones, can happen with different frequencies depending upon the biology of the sample and how it was prepared. (Figure 3)
Figure 2. Using sequence temperature values to constrain search space. (Left) First a large number of short sequence tags are called for each MS/MS spectrum. These sequence tags are then mapped to the protein database. (Right) The 7-residue segment with the sequence of the right answer for the spectrum has a ‘hot’ STV, since many tags map to this region. Because the STV is very high, this region will be searched very extensively – ie. a large number of modifications and variations will be allowed. The other regions with much cooler STVs will be searched much less extensively.
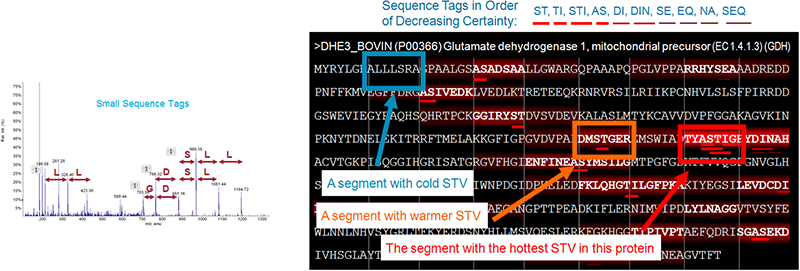
Figure 3. Using feature probabilities with sequence temperature values. Rare features – ones with low rates of occurrence – are searched only for the most highly implicated regions of the database (hot sequence temperature values). |
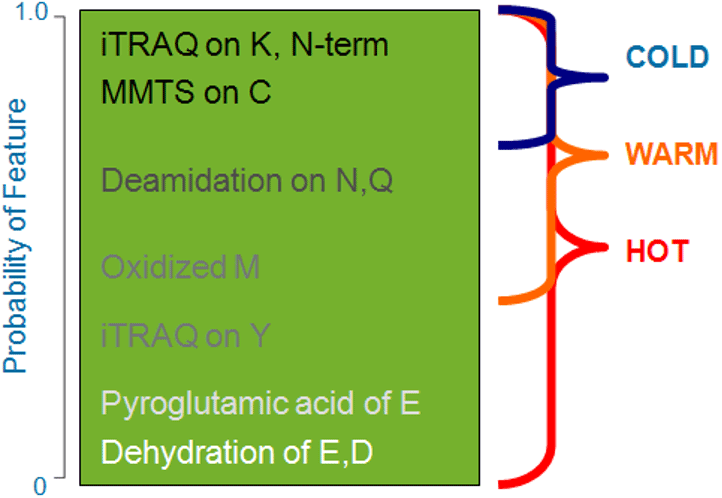
For example, if iodoacetic acid were chosen as the alkylating reagent, the Paragon Algorithm would assume carboxymethylation is highly likely on any cysteine residue, and there is a smaller chance that the cysteine will remain unmodified. It knows that iodoacetamide can also lead to a low level of iodination of histidine. If Thorough ID mode is selected, the software automatically searches for these types of less likely modifications in regions of the protein database with high sequence temperatures. To further refine feature probabilities, the Special Factors can be designed to modulate these probabilities. For example, when using a phosphorylation enrichment step, the selection of Phosphorylation Emphasis automatically tells the software to increase the probability of finding phosphorylation modifications on serine, threonine, and tyrosine. This unique feature probability methodology enables a high level of simplicity in the control of the search method (Figure 4).
Simplified user interface for search method creation
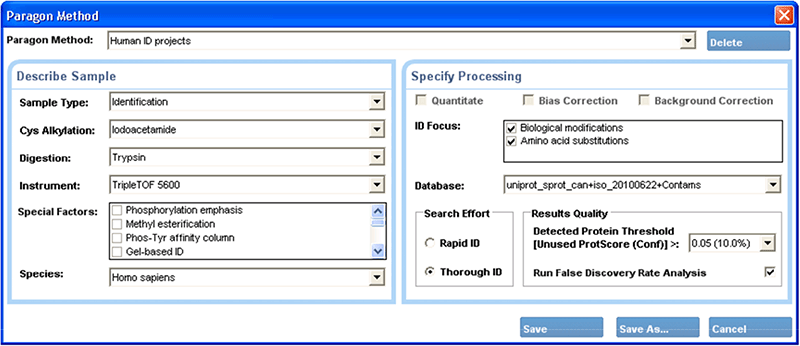
The user interface for the Paragon Algorithm is deceptively simple (Figure 4), masking the power of the underlying algorithms. It simply asks for sample information in biologist’s terms, such as the digest agent and cysteine alkylation reagent used to prepare the sample. It is not necessary to understand the basis of the algorithm and make a series of careful decisions about settings to get accurate results. It is not necessary to specify mass tolerances, individual modifications to search for, expected fragment ion types, or exceptions to cleavage rules like missed or semi-specific cleavages. All of these decisions are made automatically based upon the sample treatment and experimental goals.
Advanced users do have the ability to interact with the algorithmic setting under the hood and further refine search parameters when faced with new sample challenges. Any refinements thus made can then be displayed through the same simple interface for future searches.
Figure 4. The Paragon™ Algorithm method creation window. The simplified user interface requires only knowledge of the experimental details of the sample, enabling even users new to protein identification to obtain high quality results.
Solving the protein inference challenge with the Pro Group Algorithm
After the initial database search, the Pro Group Algorithm assembles the peptide evidence from the search into a comprehensive summary of proteins. The algorithm addresses the protein grouping problem by correctly handling the complexities posed by protein subsets and isoforms, thus avoiding the reporting of a false over-estimation of protein numbers.
Once peptides are identified, the Pro Group Algorithm performs a statistical analysis on the peptides found to determine the minimal set of confident, justifiable protein identifications. It obeys a simple principle: You cannot use the same data multiple times to justify the detection of multiple proteins. While seemingly obvious, the failure of commonly used ID tools to obey this rule is a major cause of the false protein identifications that plague proteomics research.
To enforce this principle, the Pro Group Algorithm calculates two ‘ProtScores’ for each protein. A peptide’s ability to contribute to these ProtScores is based on its confidence, with higher confidence peptides able to contribute more. The Total ProtScore is based on all found peptides pointing to any one protein, but peptide identifications can only contribute to the Unused ProtScore of a protein to the extent that their spectra have not already been used to justify an already assigned more confident protein. Proteins are only reported as detected if they have sufficient Unused ProtScore (Figure 5). The result is the positive determination of proteins actually present in the sample with accurate protein confidences reported. When redundant proteins or homologous proteins that cannot be differentiated are found, the Pro Group Algorithm organizes related proteins into protein ‘groups’. Multiple protein isoforms in a group are only declared present if unique evidence exists for each isoform.
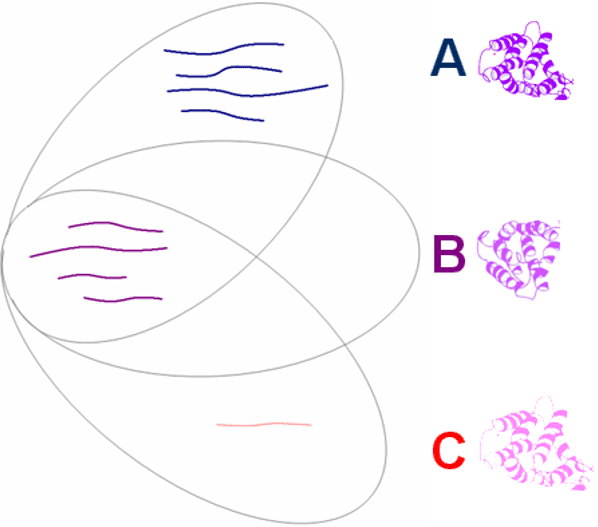
Figure 5. The protein grouping problem. Three proteins sharing peptide evidence are shown. With 8 strong peptides (shown bold in blue and magenta), it is obvious that Protein A should count toward the number of proteins detected. Protein B should not. While its Total ProtScore may be high based on the 4 (magenta) peptides, its Unused ProtScore is 0 (i.e. all evidence has already been used to justify Protein A). Protein C has a peptide unique to it (shown faintly in pink), but its confidence is so low that it is likely false. Adding Protein C to the count of proteins detected based on its high Total ProtScore would be a mistake. The Unused ProtScore is negligible, only coming from this one low confidence ID. The Pro Group Algorithm’s use of peptide confidences prevents claiming Protein C as detected. The user is not burdened with specifying arbitrary peptide thresholds.
Protein expression analysis
The study of differential protein expression analysis has increased in importance over recent years, and the diverse tools and techniques to carry it out using mass spectrometry have developed accordingly. Protein expression raw data is both complex and feature-rich. A streamlined analysis requires that powerful quantitative tools be coupled with an organized and logical presentation. ProteinPilot Software provides a reliable, sophisticated solution to this data analysis challenge.
In ProteinPilot Software, relative protein quantification information is reported for each measured protein in the Protein Quant tab. Using the results from the Pro Group Algorithm, peptide ratios are determined and an average ratio calculated for each protein, including specific analysis for protein isoforms (Figure 6). Any sample bias (from pipetting or concentration determination error) can be removed, and P-values are computed for each ratio, providing a convenient measure of its statistical significance. Each measured protein ratio is color-coded based on its P-value, enabling you to quickly focus on the proteins that show real changes in expression.
For relative quantification studies, ProteinPilot Software supports many labeling strategies, including ICAT® Reagents, iTRAQ® reagents and SILAC Reagent labeling, and provides sophisticated analysis tools for these workflows such as protein isoform-specific quantification and the ability to curate quantitative results.
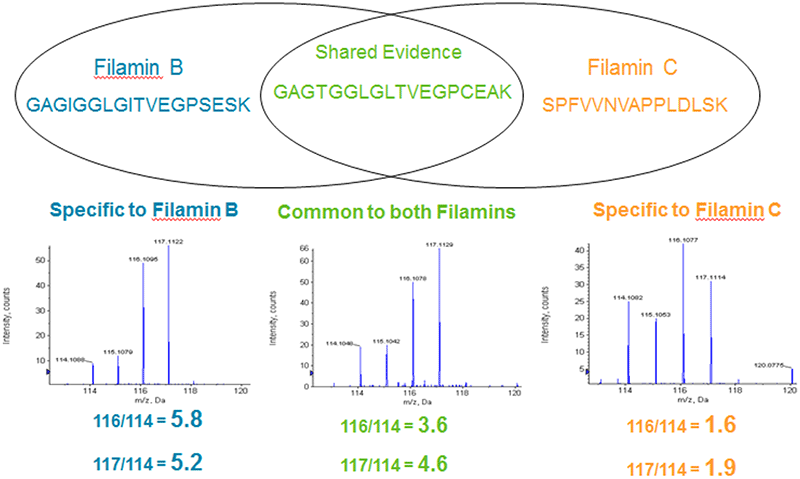
Figure 6. Isoform specific quantitation enabled by good protein inference. Because the Pro Group Algorithm assesses which isoforms are being detected, it also knows which peptides are shared and which are distinct for each isoform for computation of quantitative ratios. This iTRAQ® Reagent example shows how two different Filamin isoforms are separately quantified by excluding the peptide that is shared by both forms. Including the shared peptide would incorrectly make the C form look like it has some up-regulation and make the B form appear to have less obvious up-regulation than it does.
Advanced tools for analyzing search results
Integrated False Discovery Rate (FDR) Analysis: The principle of the target-decoy approach is to provide the search engine answers that are known to be wrong (‘decoys’) in addition to all the correct protein sequences (‘targets)’. In ProteinPilot Software, both target and decoy databases are searched automatically during a search by reversing the real protein sequences, on the fly. Error rates are estimated in the resulting answer list by seeing how these known wrong answers (false discoveries) show up in the list in comparison to all the other proteins. After the search is completed, an analysis is performed to determine the yield of proteins and peptides identified at fixed FDRs2, then a detailed report is generated (Figure 7).
ProteinPilot Report: Results from a search can also be transferred into an Excel based tool, the ProteinPilot Report.3 Here, many different qualitative and quantitative analyses are performed, providing a deep, insightful understanding of a sample, or its acquisition.
FDR Comparison Template: Because identification yields are always determined at fixed pre-defined FDR levels, comparison across multiple results is easy. A comparison template is included with the software to enable easy comparison of identification results for different experimental conditions (Figure 8).
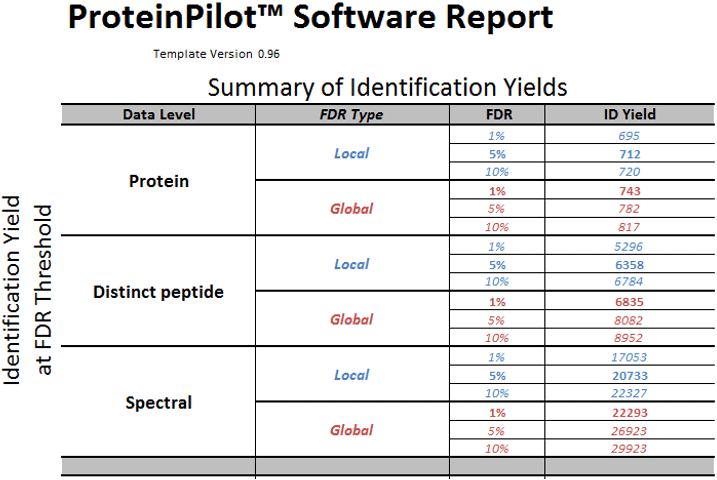
Figure 7. False discovery rate analysis report. A detailed FDR analysis provides graphics and tables to allow investigation of the number of proteins, peptides, and spectra identified at critical local or global error rates. Essential for journal publications today. |
Fitting into every lab situation
As today’s proteomics laboratories often utilize multiple types of instruments, from different vendors, the ability to use a search tool that can process data from all of the MS systems is highly desirable. ProteinPilot Software can take in data from any mass spectrometer by using a generic file format (*.mgf). In addition, the ability to search all data together into a single result in ProteinPilot Software is becoming increasingly powerful.
In core lab situations, data is acquired and searched at the central lab but the data is often analyzed by individual groups in a remote fashion. Results files generated from a ProteinPilot Software search (a Group file) can be opened and viewed using a free viewer4. The viewer has all the software functionality except for the searching capabilities and can therefore be used to visualize and interrogate sample results.
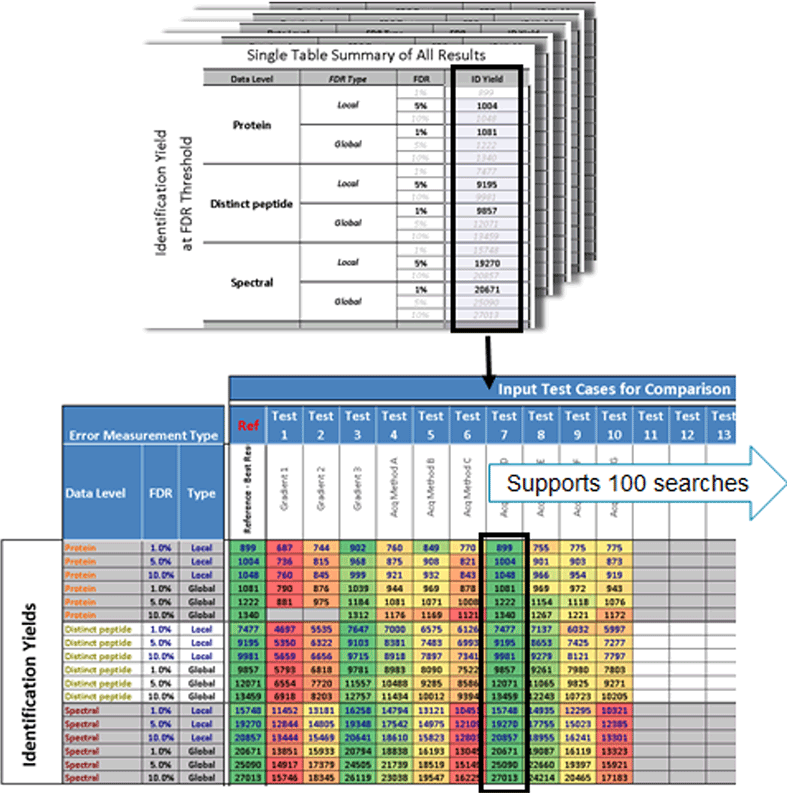
Figure 8. FDR comparison template. The resulting identification results from multiple searches can easily be compared using this comparison template. Investigation of MS acquisition settings or chromatographic conditions, or optimization of virtually any element of the workflow is easily enabled.
Conclusions
ProteinPilot Software sets a new standard for performing protein identification and biomarker discovery experiments. The sophisticated processing tools enable all users, regardless of experience, to obtain reliable, understandable results. ProteinPilot Software provides the powerful Paragon™ Algorithm to identify more from your sample – often doubling the number of spectra yielding peptide identifications. The industry leading Pro Group™ Algorithm sets the bar for reporting reliable, defensible protein identifications. Coupled with powerful mass spectrometers and labeling chemistries for protein expression analysis, ProteinPilot Software provides a significant advancement in the biomarker discovery field.
References
- Shilov IV, Seymour SL, et al. (2007) The Paragon Algorithm, a next generation search engine that uses sequence temperature values and feature probabilities to identify peptides from tandem mass spectra. Mol Cell Proteomics 6(9): 1638-55.
- Tang WH, Shilov IV, Seymour SL. (2008) Nonlinear fitting method for determining local false discovery rates from decoy database searches. J Proteome Res. 7(9): 3661-7.
- ProteinPilot™ Report from ProteinPilot™ Software - detailed analysis of protein identification / quantitation results automatically. SCIEX technical note RUO-MKT-02-1778-A.