Zeno MS/MS with microflow chromatography powers the Zeno SWATH data-independent analysis (DIA) workflow to quantify more proteins
Using the ZenoTOF 7600 system
Christie Hunter and Alexandra Antonoplis
SCIEX, USA
Abstract
Data independent acquisition (DIA) continues to grow as a key workflow in the field of quantitative proteomics. Here, the improvements in proteins identified and quantified using microflow SWATH DIA coupled with Zeno MS/MS is described. Large improvements in the numbers of proteins quantified were observed when Zeno trap was activated, especially at the lower sample loadings. Zeno SWATH DIA data processed with DIA-NN software permitted up to ~6,100 proteins to be identified using a 45-min microflow LC gradient, with ~95% of those proteins quantified at <20% CV.

Introduction
As the field of quantitative proteomics continues to evolve, larger biological cohorts are being studied, often using precious samples obtained from biobanks or other difficult-to-obtain sources. This creates 2 workflow requirements: the need to acquire quantitative data on the digested samples faster and the need to use smaller amounts of sample. For these types of studies, data-independent acquisition (DIA) continues to grow as the workflow of choice for reproducible quantitative analysis of large numbers of proteins from a proteomic sample.
Previously, the combination of fast microflow chromatography and SWATH DIA enabled large numbers of proteins to be quantified from complex proteomics samples at very high rates, up to 100 samples per day.1 The activation of the Zeno trap has been shown to improve MS/MS sensitivity for peptide quantification by improving the duty cycle of the ZenoTOF 7600 system.2,3 Coupling SWATH DIA with Zeno MS/MS and microflow LC therefore has the potential to significantly enhance a core quantitative proteomics workflow.
Here, the use of microflow chromatography in combination with Zeno SWATH DIA was optimized and evaluated compared to traditional SWATH DIA to characterize the impact of the Zeno MS/MS sensitivity gains. Four different gradient lengths (5, 10, 20 and 45 minutes) were tested to cover a range of application needs.
Key features of Zeno SWATH DIA with microflow LC
- Zeno trap provides an increase to ≥90% duty cycle across the entire mass range for MS/MS acquisition modes, therefore providing MS/MS sensitivity improvements for peptides of 5-6x on the ZenoTOF 7600 system3
- Microflow chromatography provides higher robustness and faster runtimes (5 µL/min, 300 µm inner diameter column)
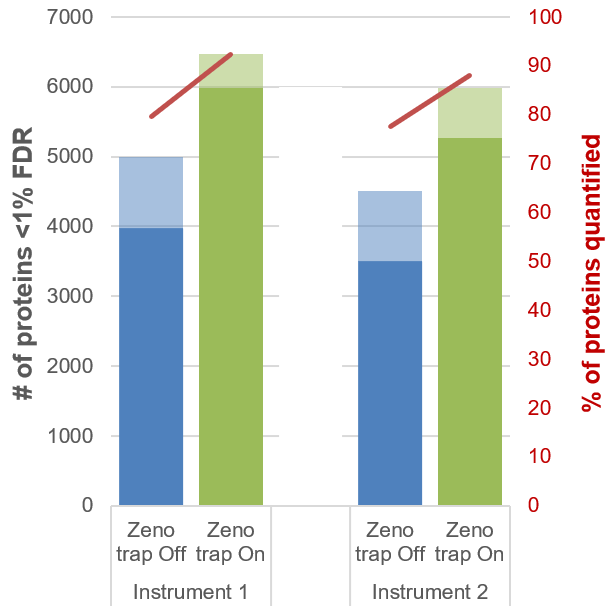
- Variable window SWATH DIA with the Zeno trap activated, termed Zeno SWATH DIA, provides large gains in proteins and peptides quantified, with 50% more proteins quantified at higher loads (Figure 1)
- Typically, more than 90% of the proteins identified from the Zeno SWATH DIA data are also quantified with <20% CV (Figure 1)
- DIA-NN software for data processing provides a powerful solution for extracting many peptides and proteins from these information-rich datasets
Figure 1. Large improvements in proteins quantified with Zeno SWATH DIA with microflow LC. The numbers of proteins identified at <1% FDR (transparent) and quantified at <20% CV (solid) using SWATH DIA were compared with and without the Zeno trap activated for a 45-min gradient and at 400 ng of sample load. Approximately 50% more proteins were quantified using Zeno SWATH DIA on both instruments. In addition, ~90% of identified proteins were quantified at <20% CV (red line).
Methods
Sample preparation: Digest of human K562 cell lysate was used from the SWATH Acquisition performance kit (SCIEX). Sample loadings ranged from 12.5–400 ng on column.
Chromatography: Separations were performed using a Waters ACQUITY UPLC M-class system plumbed for microflow chromatography (5 µL/min), operated in trap/elute mode. The trap column was a Phenomenex micro trap (5 µm, 100 Å, 10 x 0.3 mm) and the analytical column was a Phenomenex Kinetex XB-C18 (2.6 µm, 100 Å, 150 x 0.3 mm). Column temperature was controlled at 30 °C. Gradients of 5, 10, 20 or 45 minutes were tested (Table 1).
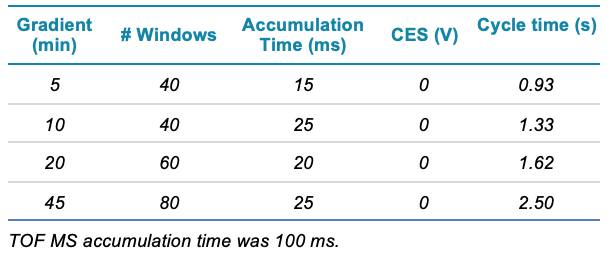
Table 1. Gradient profiles used for the protein quantification comparisons. The experiments are named according to the duration of the linear portion of the gradient were the majority of peptide elute.

Mass spectrometry: Data were acquired using 2 ZenoTOF 7600 systems using SWATH DIA mode. Variable window acquisition was used and the use of 40, 60 or 80 windows and the MS/MS accumulation time were optimized for each gradient length (Figure 2 and Table 2). Data were acquired in triplicate with the Zeno trap on and off in MS/MS mode for comparison. In Zeno SWATH DIA mode, the Zeno trap is on continuously for all MS/MS. Scheduled ionization was used to stop ionization during the high flow flush.
Data processing: Data were processed using a spectral ion library previously generated from 2 fractionated human cell lysates.4 Data from each fractionation experiment of each cell line were processed into a single search result using the ProteinPilot app in OneOmics suite. The search results for each cell line were then merged using the Extractor application to create a final ion library for SWATH DIA processing. DIA-NN software was used to process all the SWATH DIA data, and processing settings were described in a community post.6 Protein and peptide precursor areas from the *.pr_matrix.tsv and *.pg_matrix.tsv files (<1% FDR filter applied) were copied into Microsoft Excel and the numbers of proteins and peptides quantified at 20% CV were computed.
Figure 2. Variable Q1 windows tested during method optimization. Variable Q1 window patterns were optimized based on MS signal density for a proteomics sample (blue) using the SWATH DIA variable window calculator.5 The use of more windows reduced the size of the Q1 windows and therefore improved specificity.
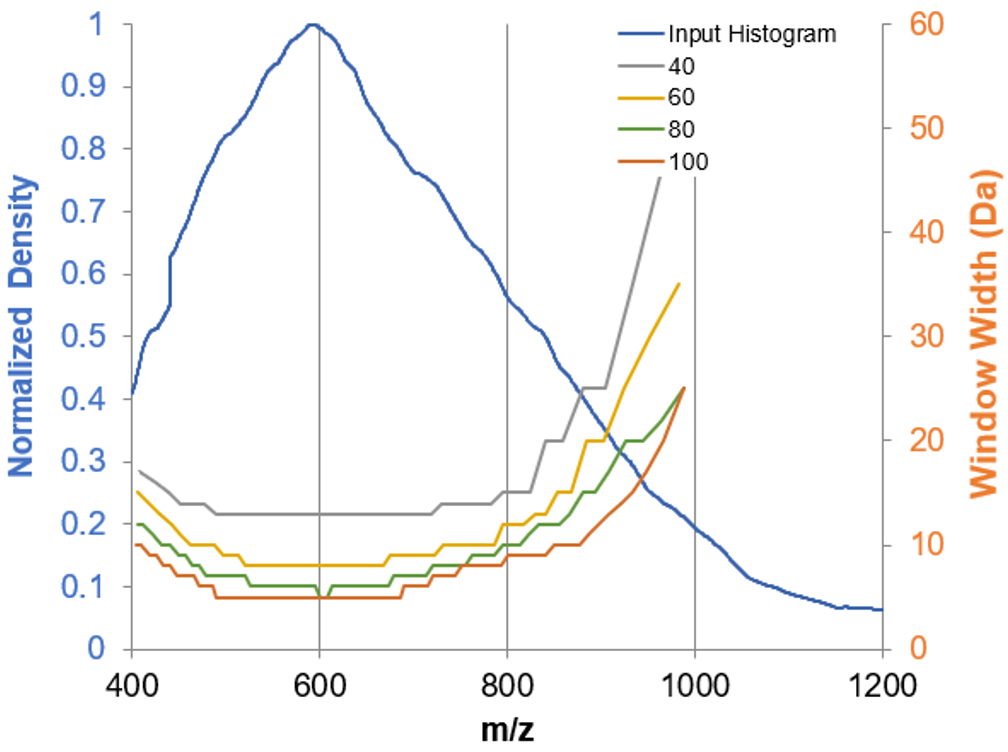
Table 2. Optimized Zeno SWATH DIA method settings. Various acquisition conditions were tested on 2 ZenoTOF 7600 systems to determine the optimized conditions for collection of the final datasets.
Evaluating gains for Zeno SWATH DIA
SWATH DIA and Zeno SWATH DIA datasets that spanned a range of sample loadings were acquired using a 45-min gradient on 2 ZenoTOF 7600 systems to confirm MS/MS sensitivity gains. An example of the raw data generated from the peptide TLGEC[CAM]GFTSQTAR from the sample sp|Q15370|ELOB_HUMAN shows a ~6-fold increase in peak area when the Zeno trap is activated (Figure 3, top). The high-quality MS/MS spectrum from which the XICs were obtained is shown (Figure 3, bottom).
Next, both the SWATH DIA and Zeno SWATH DIA loading curves were processed with DIA-NN software to determine the numbers of proteins and peptides that could be reproducibly quantified. Figure 4 shows the data from the 45-min gradients run on the 2 ZenoTOF 7600 systems at each loading amount for SWATH DIA and Zeno SWATH DIA. The numbers were similar between instruments, with some variation expected due to the independent configurations of the mass spectrometers, LC systems, traps and columns. As expected, more proteins were quantified as the loading amount increased. On average, at a protein load of 400 ng of K562 on column for a 45-min gradient, ~6200 proteins were identified and ~5,600 of these proteins were quantified at <20% CV.
Figure 3. Gains in peptide signal with Zeno MS/MS activated during SWATH DIA. (Top) Extracted ion chromatograms (XICs) of peptide TLGEC[CAM]GFTSQTAR from sp|Q15370|ELOB_HUMAN from the SWATH DIA and Zeno SWATH DIA experiments (100 ng of sample, 45-min gradient). (Bottom) MS/MS spectrum from the Zeno SWATH DIA experiment, with the extracted fragments shown in the Zeno SWATH DIA XIC plot labeled in red.
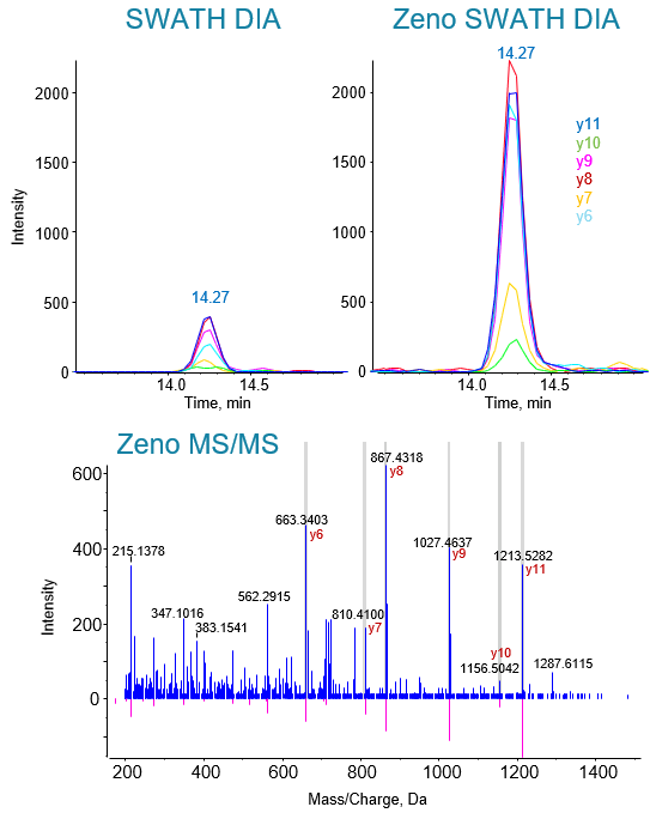
Figure 4. Protein and peptide precursor loading curves for the 45-min gradient with and without Zeno MS/MS. The numbers of proteins (top) and peptides (bottom) quantified increased as sample load was increased on both instruments. Gain fold changes when using Zeno SWATH DIA are plotted in Figure 5 for reference. The optimal loading amount was 200-400 ng of cell lysate digest on column.
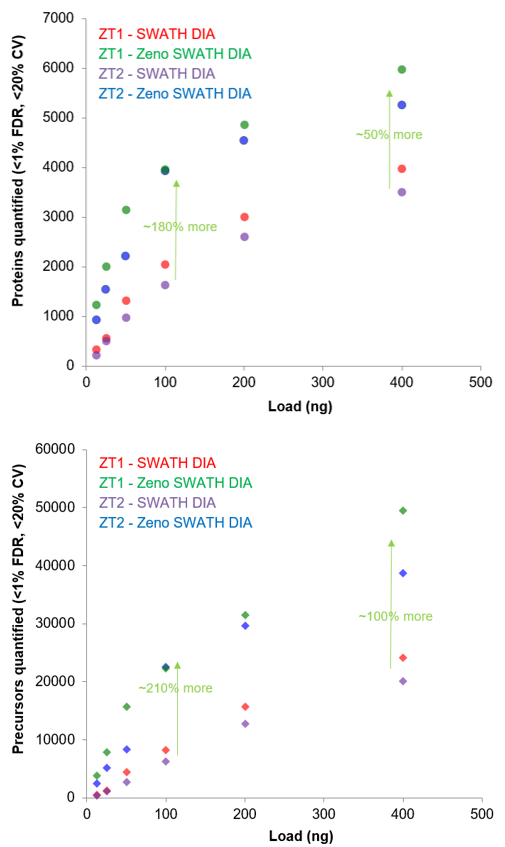
The use of Zeno SWATH DIA resulted in large increases in the number of proteins and peptides quantified at specific sample loads, relative to SWATH DIA. The gains observed were higher at the lower sample loads at both the protein and peptide levels (Figure 5).
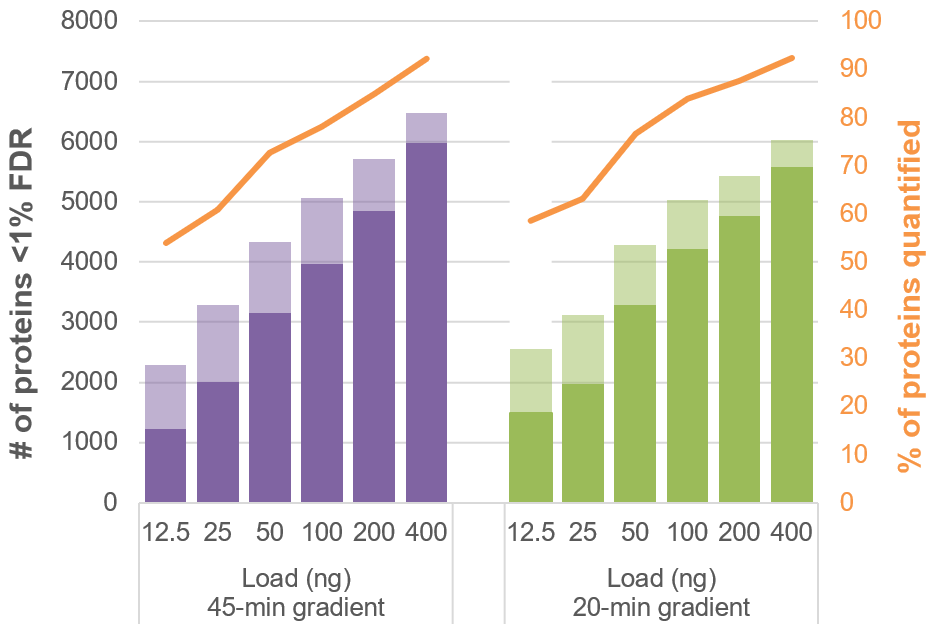
Next, the proteins and peptides identified vs. quantified for the load curves were plotted and compared between the 45-min and 20-min gradients (Figure 6). At the lower loads, ~70% of proteins identified were quantified with <20% CV. At the higher loads, more than 90% of proteins identified were quantified with <20% CV. These results highlight the quality of the Zeno MS/MS data for both identification and reproducible quantification.
Figure 5. Gains in proteins and peptide precursors quantified with Zeno SWATH DIA. The fold change increase in the numbers of proteins (circle) and peptides (diamonds) was computed for datasets collected on each instrument using a 45-min gradient. Larger gains were observed at the lower loads.
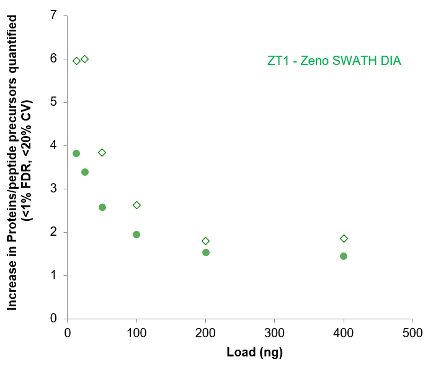
Figure 6. Proteins identified and quantified at different loadings for 45- and 20-min gradients. The number of proteins identified at <1% FDR (transparent) and quantified at <20% CV (solid) using Zeno SWATH DIA across a range of loadings was studied. At loads ≥50 ng on column, 80-90% of proteins identified were also quantified.
Faster gradients
The impact of microflow chromatography speed was explored by testing 4 LC gradient lengths. For each gradient length, the number of proteins quantified was measured. Load curves were generated to evaluate both impact on the number of proteins quantified and to determine the optimal loading amounts for future experiments (Figure 7). Running the longer 20- or 45-min gradients on the 300 µm x 15 cm microflow column permitted the loading of more protein and therefore resulted in more proteins quantified from the sample. The shape of the load curves revealed that the optimal loading amount for the shorter 5- and 10-min gradients was ~100 ng of sample on column. The optimal loading amount for the longer 20- and 45-min gradients was approximately 200-400 ng of sample on column (Figure 7).
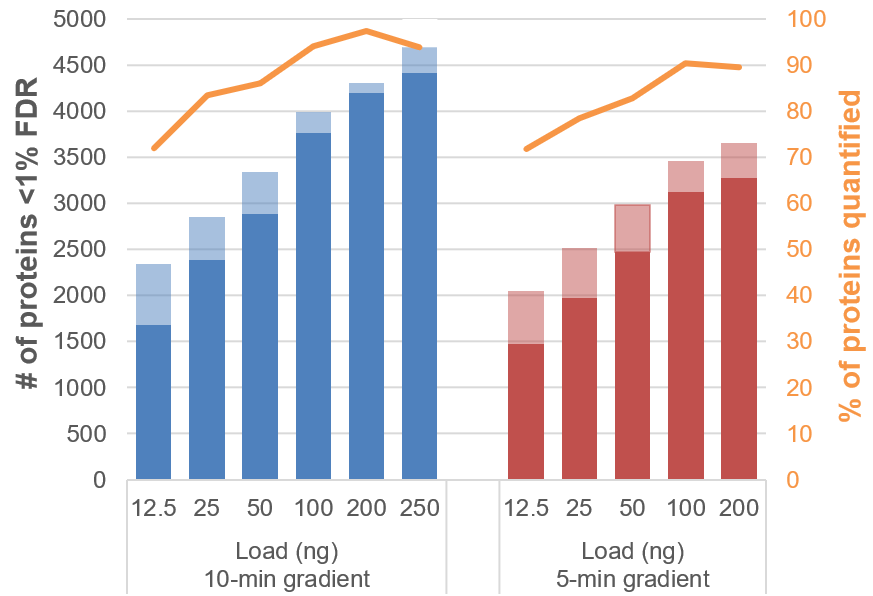
As expected, the numbers of proteins identified and quantified decreased as the microflow gradient duration was shortened. Nearly as many proteins were quantified using the 20-min gradient as were quantified with the 45-min gradient at similar loads. This result suggests that this length gradient is the optimal chromatography protocol for this acquisition configuration (300 µm ID column at 5 µL/min), as it achieves balance between peak shape and peptide separation (Figure 7). Using the 10-min gradient provided a further acceleration in sample throughput with a small loss in total protein coverage. With a load of 200 ng of sample, the 10-min gradient resulted in the identification of ~4,300 proteins, ~97% of which had CV values <20% (Figure 8). Figure 7 highlights that for small loads of cell digest on column, faster gradients are preferred and there is little advantage to using a longer gradient. At sample loadings of 12.5 to 50 ng on column and with this flow rate and column size, the 10-min gradient yielded suitable protein coverage and good sample throughput.
Figure 7. Comparing load curves from the different gradient lengths. Visualizing loading curves allows users to select optimal loading amounts to achieve the best results and system uptime. Longer gradients enable higher loadings until improvements in quantification plateau. For this application, a load of approximately 100 ng of protein on column was optimal for 5- and 10-min gradients, whereas a load of approximately 400 ng of protein was optimal for 20- and 45-min gradients.
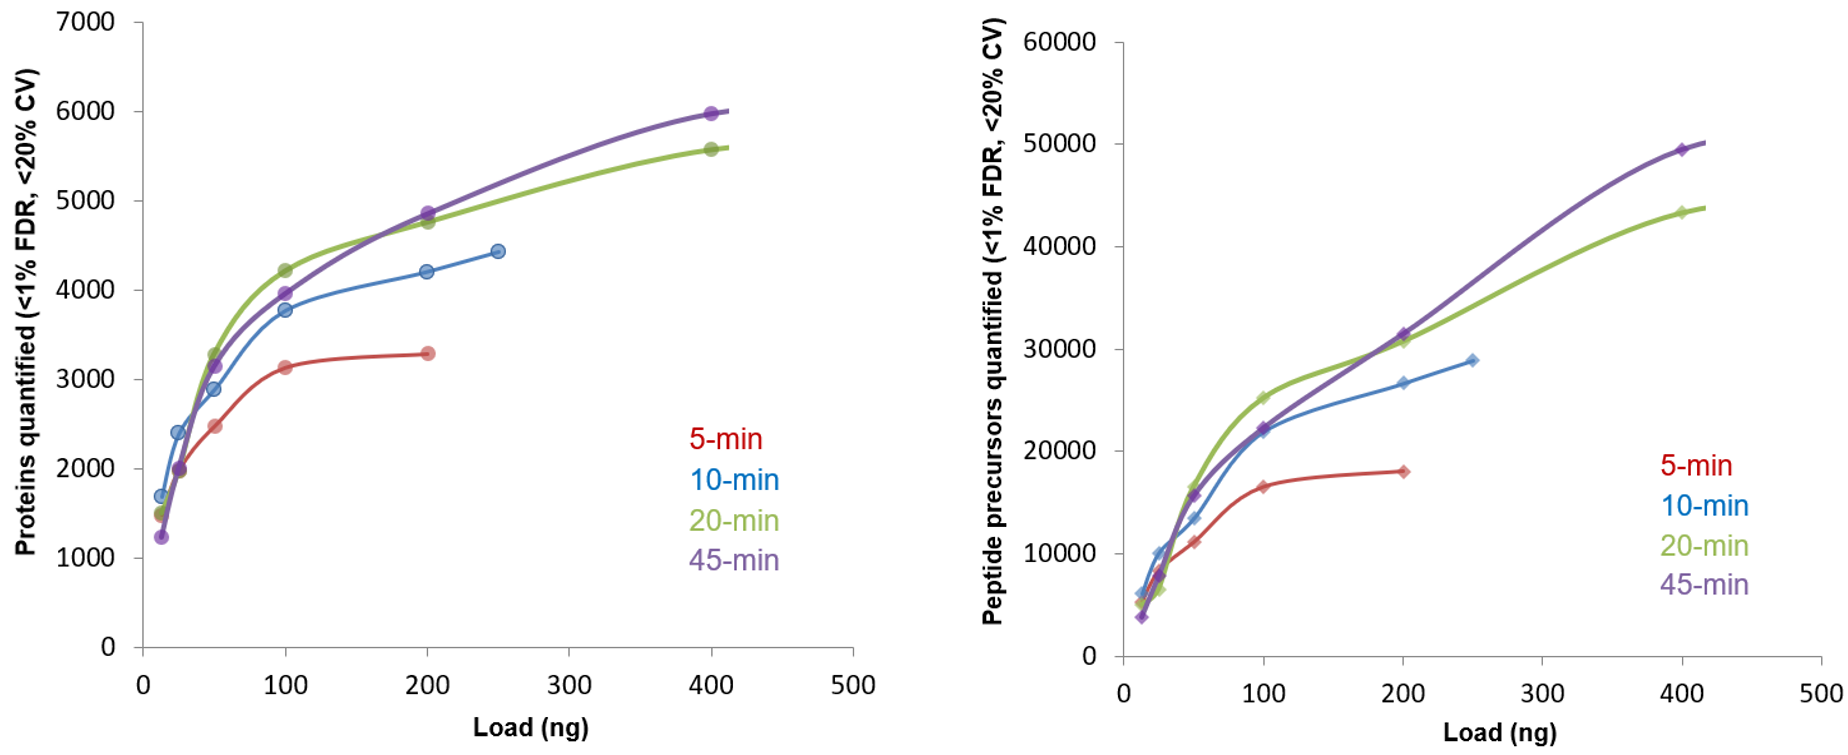
Figure 8. Proteins identified and quantified for 10- and 5-min gradients. The number of proteins identified at <1% FDR (transparent) and quantified at <20% CV (solid) across a range of loadings was studied when using a 10- (left) or 5-min (right) gradient. Using these fast gradients, 80-90% of proteins identified were also reliably quantified.
Finally, using the Zeno SWATH DIA data from the 20-min gradient, the distribution of the measured protein %CV was plotted to visualize the overall protein variance across the dataset (Figure 9). As expected, at the lower loads there was more observed variance. At the higher loads, which are more similar to the loading range appropriate for the column used in these experiments, the %CV distributions were predominantly <20%, with distribution medians of 7.5%, 6.4% and 4.7% for the loads of 100, 200 and 400 ng of protein on column, respectively.
Figure 9. Observed protein quantification variance using a 20-min gradient. Violin plot of the %CV values observed for all detected proteins at each of the loading levels. Green dot is average %CV, thick black line is median. Loadings >50 ng demonstrated %CV distributions well below <20%, consistent with the appropriate loading range of the 300 µm inner diameter column used for these experiments. Numbers of proteins included in this plot can be visualized in Figure 6.

Conclusions
The Zeno trap is a key innovation on the ZenoTOF 7600 system that provides large gains in MS/MS sensitivity and enables significant improvements in protein identification workflows,7 targeted peptide quantification workflows3 and the SWATH DIA workflow.
- Zeno SWATH DIA provides large gains in the numbers of proteins quantified from human cell lysate samples, with 50% more proteins quantified at high loads and 200-400% more quantified at low loads
- The high quality of the Zeno MS/MS spectra permits many identified proteins to be quantified reproducibly with <20% CV
- Zeno SWATH DIA is readily compatible with fast microflow gradients, enabling up to ~6,000 proteins to be quantified, depending on the selected gradient and sample load
- DIA-NN software provides a robust processing engine to identify and quantify proteins from Zeno SWATH DIA data acquired on the ZenoTOF 7600 system.
References
- Accelerating SWATH acquisition for protein quantitation – up to 100 samples per day. SCIEX technical note, RUO-MKT-02-8432-A.
- Qualitative flexibility combined with quantitative power. SCIEX technical note, RUO-MKT-02-13053-A.
- Large-scale, targeted, peptide quantification of 804 peptides with high reproducibility, using Zeno MS/MS. SCIEX technical note, RUO-MKT-02-13346-A.
- Large-scale protein identification using microflow chromatography on the ZenoTOF 7600 system. SCIEX technical note, RUO-MKT-02-14415-A.
- SWATH DIA variable window calculator. SCIEX software downloads.
- Processing ZenoTOF 7600 system data with DIA-NN software. SCIEX community post, RUO-MKT-18-14611-A.
- Over 40% more proteins identified using Zeno MS/MS. SCIEX technical note, RUO-MKT-02-13286-A.
- Wang Z et al. (2022) High-Throughput Proteomics of nanogram-scale samples with Zeno SWATH DIA. bioRxiv 2022.04.14.488299.
Related content
- Going library-free for protein identification using Zeno SWATH DIA and in silico-generated spectral libraries. SCIEX technical note, RUO-MKT-02-14675-A.
- High-throughput quantitative proteomics using Zeno SWATH DIA and the EvoSep One system. SCIEX technical note, RUO-MKT-02-14799-A.
- Nanoflow Zeno SWATH DIA for high sensitivity protein identification and quantification. SCIEX technical note, RUO-MKT-02-14798-A.