Automating high-throughput ADME assays with LeadScape® 3.0 Analyze software on the Echo® MS system
Han Wang1, Christie Hunter2, John Gibbons3 and Parikshit Gokhale3
1SCIEX, Singapore; 2SCIEX, USA; 3SCIEX, Canada
Abstract
Rapid screening during lead optimization is critical to progress drug candidates through the pipeline efficiently. The very high-throughput Echo® MS system provides sensitive, accurate and reproducible quantitative MS results at the speed of a plate reader. LeadScape Analyze software provides automatic method creation, batch generation, data processing and results generation, to accelerate throughput and Turnaround Time (TAT) for ADME studies while minimizing user intervention.

Introduction
Scientists working in lead optimization need to provide rapid, quantitative results to their biology teams to assess drug candidates quickly and reproducibly. Currently, method and batch creation are often a bottleneck when analyzing hundreds to thousands of compounds. LeadScape Analyze software helps to address this bottleneck by building a bridge between the DiscoveryQuant software database and the Echo MS system.
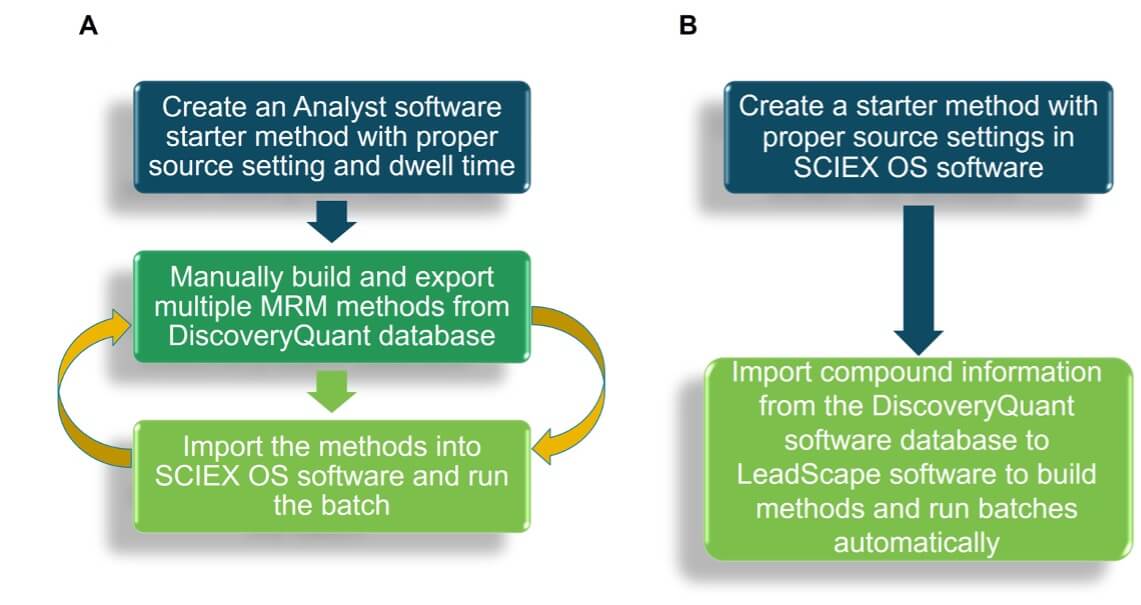
DiscoveryQuant software permits optimized parameters for MRM analysis to be easily generated and stored in the software database for LC-MS/MS analysis. LeadScape Analyze software on the Echo MS system can then use this MRM information to automatically build methods, run batches, process data and generate results without additional interactions with SCIEX OS software (Figure 1). This capability facilitates result generation, for example, enabling users to quickly assess physiological properties of drug candidates from lead identification (high-throughput screening, HTS) and make faster, better decisions towards lead optimization.
Assays in adsorption, distribution, metabolism and excretion (ADME) profiling workflows require the ability to collect data using a high-throughput approach. With Acoustic Ejection Mass Spectrometry (AEMS) employed on the Echo MS system, sample volumes as small as 2.5 nL are delivered through an Open Port Interface (OPI) that is connected to the SCIEX Triple Quad 6500+ mass spectrometer.1 A carrier solvent is used to deliver the sample into the electrospray ionization OptiFlow Turbo V ion source to analyze samples at rates of up to 1 second per sample with minimal carryover. Compounds are analyzed using high-specificity MRM analysis, using optimized parameters to maximize sensitivity.
In addition to a high sample throughput, the Echo MS system with LeadScape Analyze software provides a streamlined batch creation and analysis workflow that is coupled with automated processing. This workflow can be fully integrated into an existing LIMS, enabling precise quantitative results to be achieved as early as the same day.
Figure 1. LeadScape Analyze software streamlines batch creation for data acquisition. (A) Without LeadScape Analyze software, MRM methods must be manually exported from DiscoveryQuant software and imported into SCIEX OS software to run the batch. (B) With LeadScape Analyze software, MRM parameters can be directly imported from DiscoveryQuant software database and sample batches can be automatically created and submitted to SCIEX OS software for data acquisition.
Key features of LeadScape Analyze softwarefor high-throughput ADME screening
- LeadScape Analyze software seamlessly integrates with SCIEX OS software to provide method creation and batch generation to significantly minimize time spent on manual method creation during compound analysis on the Echo MS system
- Directly import compound information from DiscoveryQuant software database for analysis on the Echo MS system
- Numerous compounds can be analyzed automatically from method creation to results generation
- Compounds can be monitored using multiple fragments
- Both screening and calibration curve workflows are supported
Methods
Sample preparation: The Essential LC-MS Performance Kits were supplied by SCIEX. Two samples were prepared in this study. Sample 1 was prepared by mixing 10x diluted Toxicology QC Mix (Part #: 5056824), 10x diluted Environmental QC Mix (Part #: 5056820), 100x diluted SM Pharma QC Mix (Part #: 5056816) and 1000x Triazine Pesticides Mix (Sigma-Aldrich, Part #: CRM 48392), all were mixed at 1:1:1:1. Sample 2 was prepared by diluting Triazine Pesticides Mix 50x, 100x, 500x, 1000x, 5000x, 10,000x and 50,000x by volume with water.
Prior to analysis on the Echo MS system, 50 μL of each sample was transferred to an Echo 384-well plate (Beckman Life Sciences, 384PP 2.0 Microplate). The plate was centrifuged at 3,000 rpm for 5 minutes and then shaken at 1,350 rpm for 1 minute.
Acoustic ejection: Methanol with 0.1% formic acid was used as carrier solvent at a flow rate of 360 μL/min. The sample volume for ejection into the mass spectrometer for analysis was 2.5 nL.
Mass spectrometry: The Echo MS system included a SCIEX Triple Quad 6500+ mass spectrometer and was controlled by SCIEX OS software, version 2.2.0. The ESI source was operated at 300°C with a capillary voltage of 5000 V for positive ionization mode or 4500 V for negative ionization mode. The GS1 and GS2 gas flows were set to 90 and 40 psi, respectively.
Data processing: SCIEX OS software, version 2.2.0 was used for the optimization of the source parameters, automatic integration of the MS peaks and automatic creation of the results and associated .txt files for LIMS integration. LeadScape Analyze software version 3.0.0 was used to retrieve compound information from the DiscoveryQuant software database, automatic method creation, batch generation and results review with the associated .txt file.
Import of optimized MRM methods from compound database
In ADME analysis, compound optimization is performed using LC-MS/MS analysis. DiscoveryQuant software automates the rapid optimization of MRM method parameters for large numbers of compounds and stores these parameters in a compound database. A typical compound database can contain thousands of compounds. When performing screening assays, these parameters must be retrieved to build acquisition methods. Acquisition batches must then be created to analyze hundreds to thousands of compounds. This process can be extremely tedious without the right software tools for automating and streamlining the process.
LeadScape Analyze software automates this process by connecting directly with the DiscoveryQuant software database to retrieve compound information for MRM analysis. Optimized MRM transitions based on LC-MS/MS analysis can be directly adopted for Echo MS analysis.3 Sample acquisition batches can be built automatically to drive both acquisition and results generation. Figure 2 outlines the step-by-step workflow used by LeadScape Analyze software.
There are 2 ways to create the MS method and generate an acquisition batch, both of which involve importing compound information directly from the DiscoveryQuant software database. Typically, a sample list called “Import File” is generated that contains the compound names and their locations on the plate
(Figure 3). Alternatively, a user can import a compound list that includes the plate layout into the template and use the “Cassetting” function in LeadScape Analyze software to group compounds of interest into a MS method. After retrieving compound details, pre-defined acoustic ejection (AE) and starter MRM methods are selected. The data processing method is then associated with the samples and the batch is ready for submission.
Only 5 steps are required from loading the Import File sample list to obtaining usable data (Figure 4), which limits the need for user intervention and makes the LeadScape software workflow easy to use and less prone to user error. SCIEX OS software is used to generate a universal AE method and starter MRM method with generic source conditions. All other workflow steps are performed in LeadScape Analyze software.
Figure 2. LeadScape Analyze software workflow. First, a sample list is created, compounds of interest loaded into LeadScape software, and compound details are retrieved from the DiscoveryQuant software database or LIMS system. Next, acoustic ejection (AE) and MS methods are selected, and dwell times are adjusted based on the number of MRM transitions. Data processing methods are associated to drive results generation. The batch can be previewed for accuracy then submitted for acquisition and can be monitored in real-time. Finally, the Echo MS system data can be reviewed in SCIEX OS software to report the results.
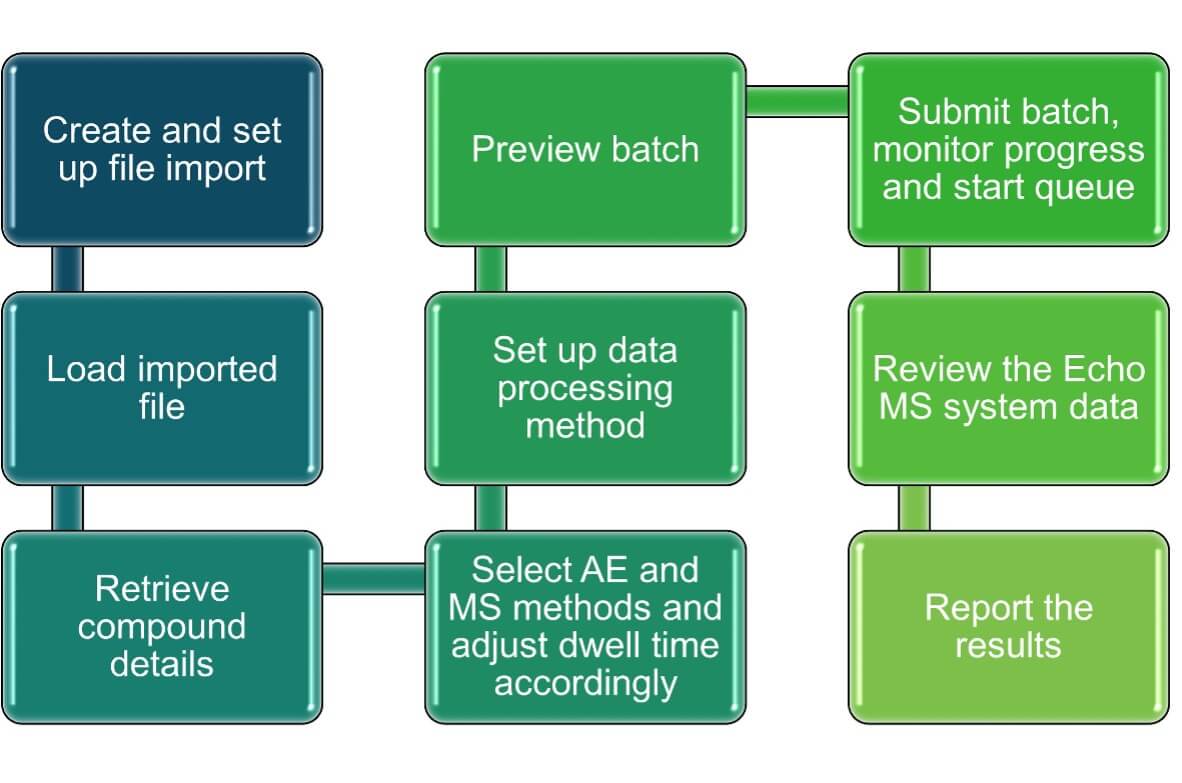
Figure 3. An example of an Import File sample list. A typical Import File sample list includes information such as sample name, acquisition method name, plate code, vial position, set name, data file name, compound names, marker well, processing method name and result file name. Selected columns are shown above.
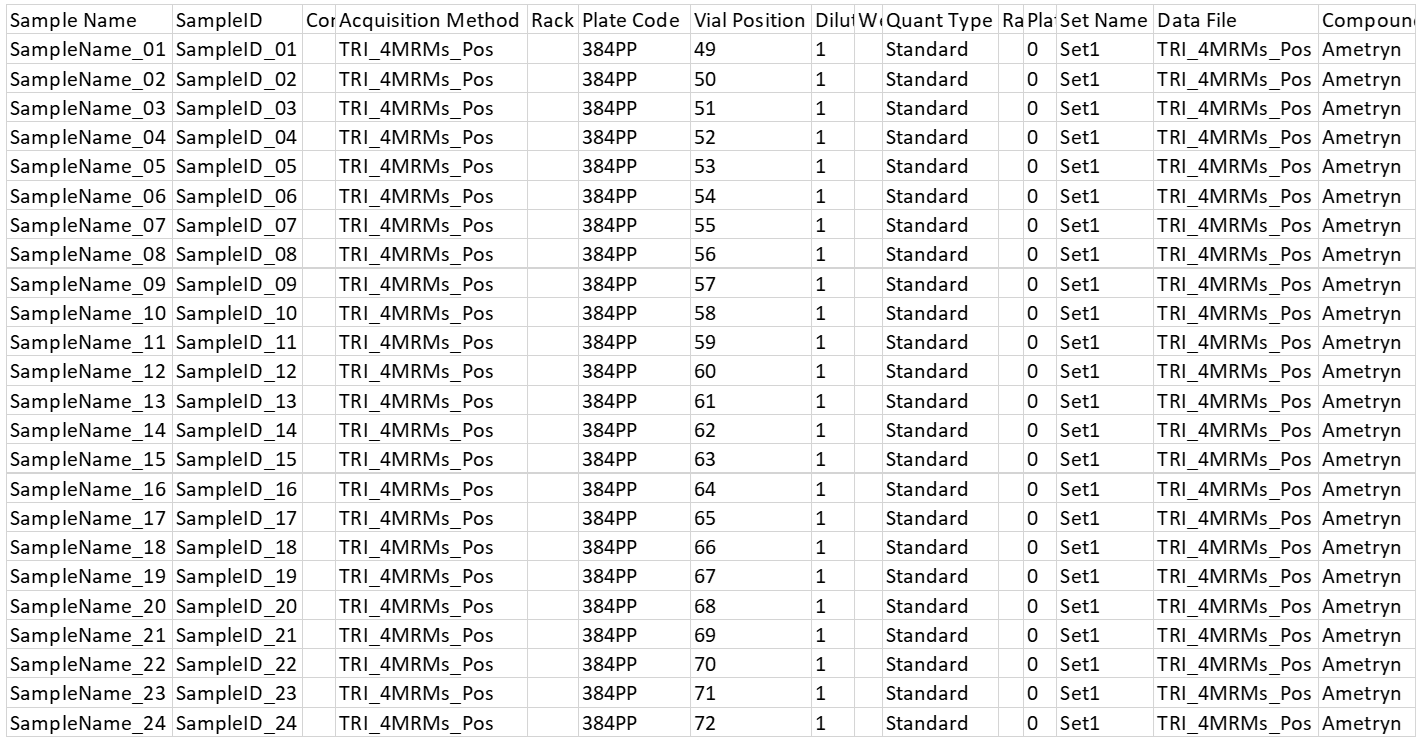
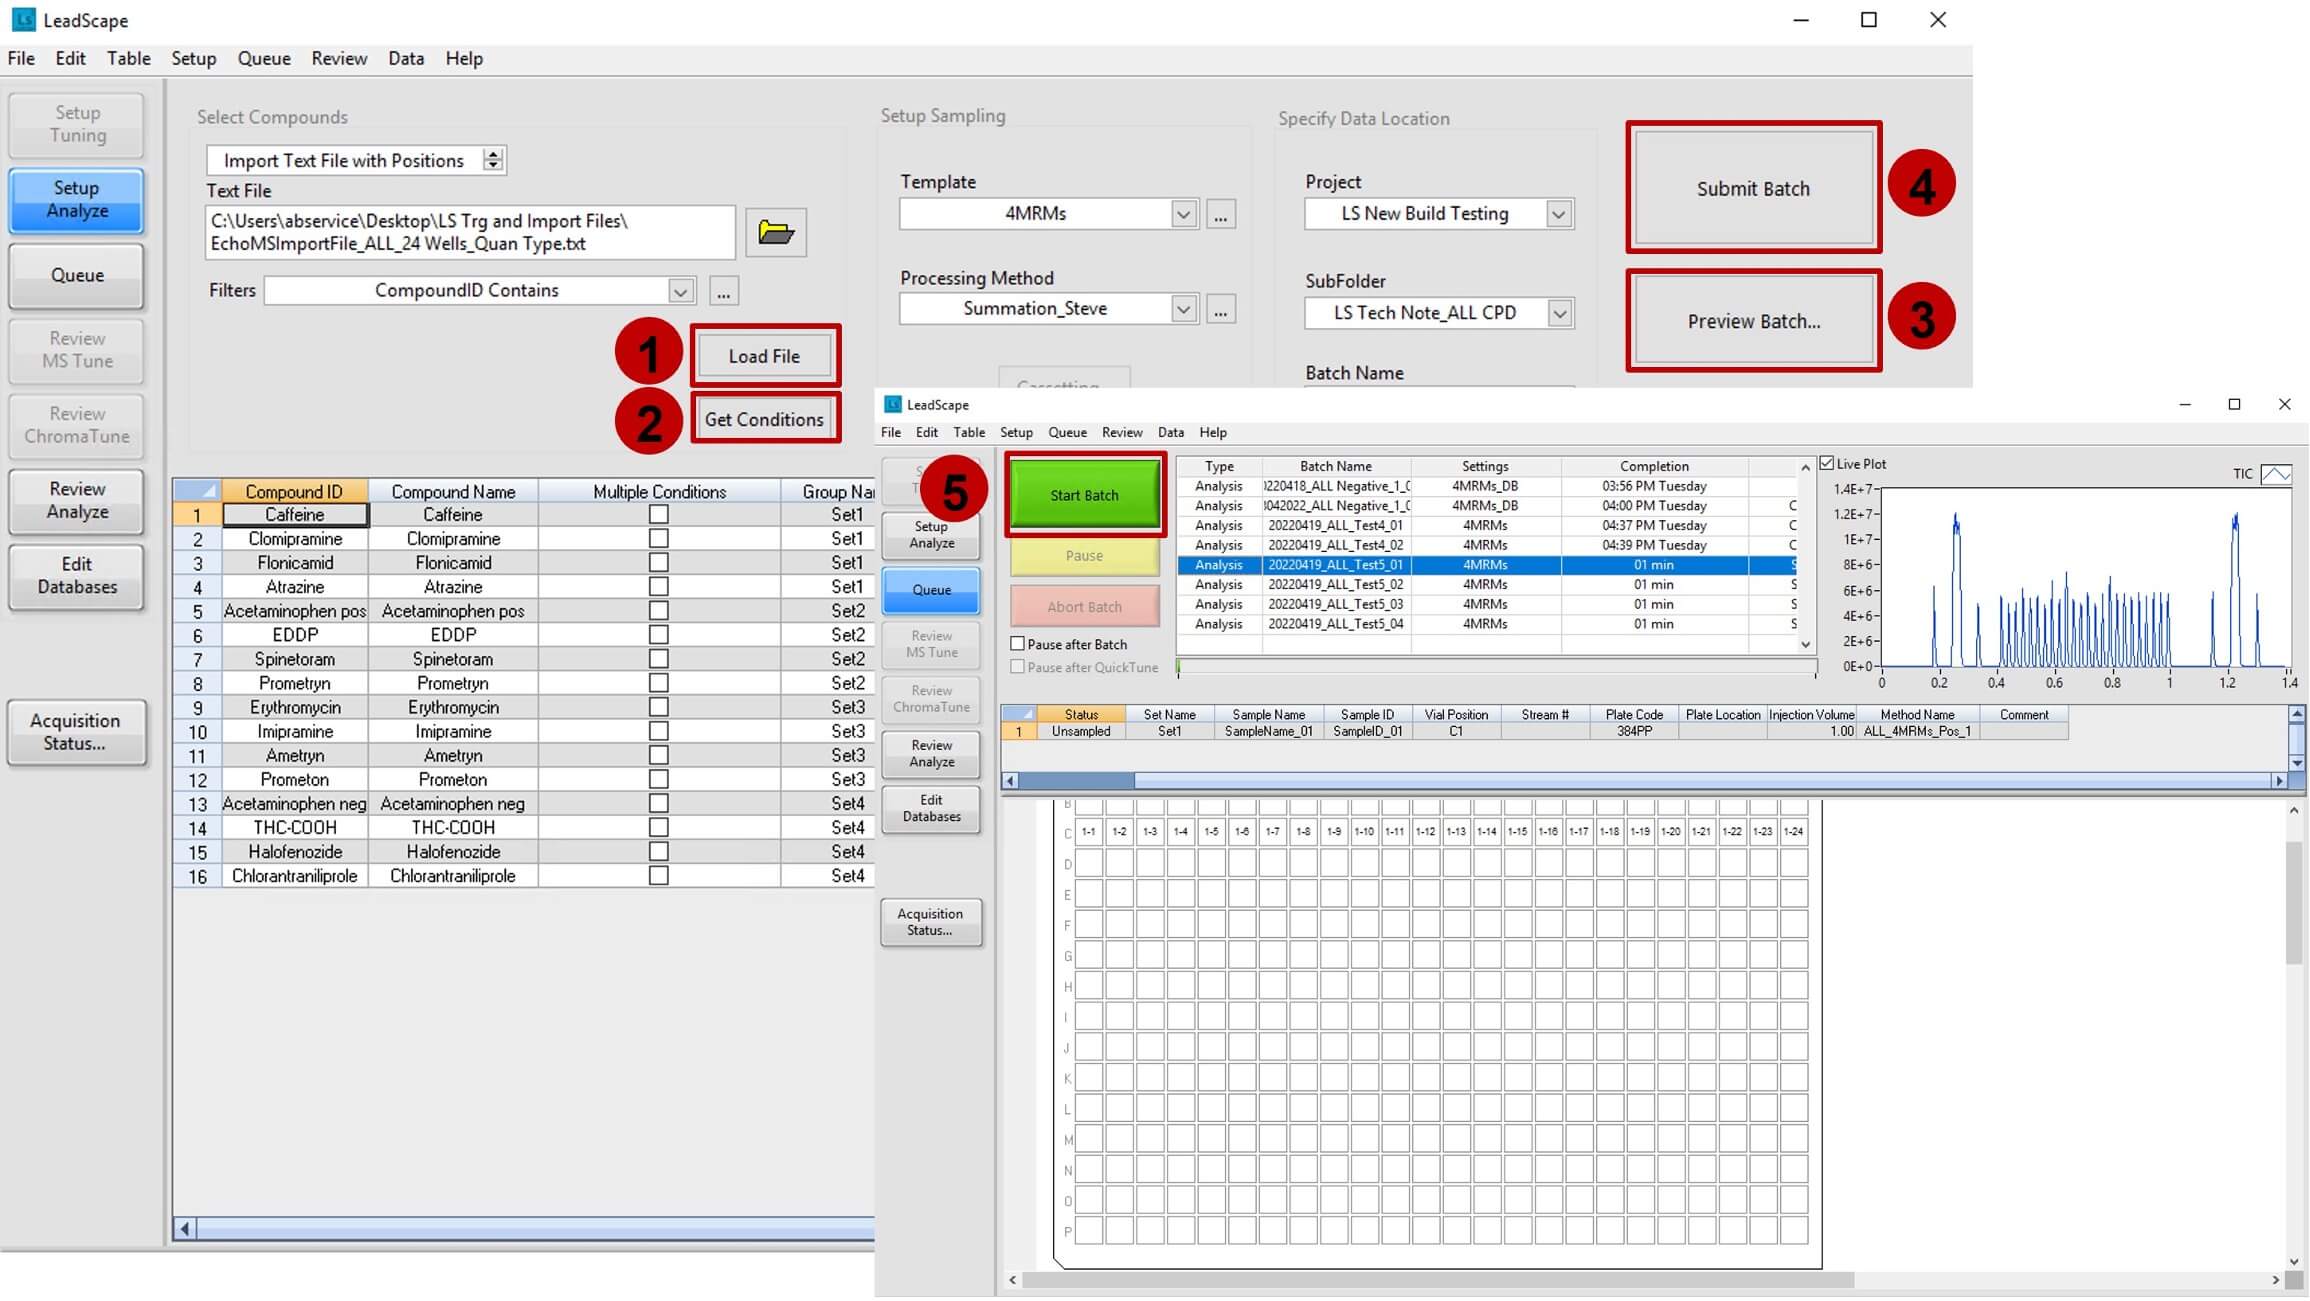
Figure 4. Only 5 steps separate loading batch files and obtaining usable data, limiting user intervention. (1) Load Import File sample list. (2) Retrieve compound details and select the generic AE, MRM acquisition and data processing methods that are pre-built in SCIEX OS software. (3) Preview batch to ensure no errors. (4) Submit batch. (5) Start batch.
Analyze numerous compounds automatically
LeadScape Analyze software enables numerous compounds to be analyzed in a single experiment by grouping multiple compounds into multiple MS methods. A single Import File sample list can contain multiple compounds and can be used to build multiple methods. Using this approach, the total number of concurrent MRMs in each method does not exceed the recommended value for the cycle time for the Echo MS system (typically 100 ms and up to 4 MRM transitions). These methods are then run in a series of batches automatically, allowing an infinite number of compounds to be acquired.
To demonstrate, 15 compounds were analyzed across 24 different sample wells (all technical replicates) in a single experiment using 16 MRMs in either positive or negative ion mode. The software automatically generated 4 MRM methods to cover the 16 MRMs and created 4 acquisition batches. After clicking “Start Batch,” data acquisition started on the first batch then automatically moved to the next batch until all the batches were completed and respective results were generated.
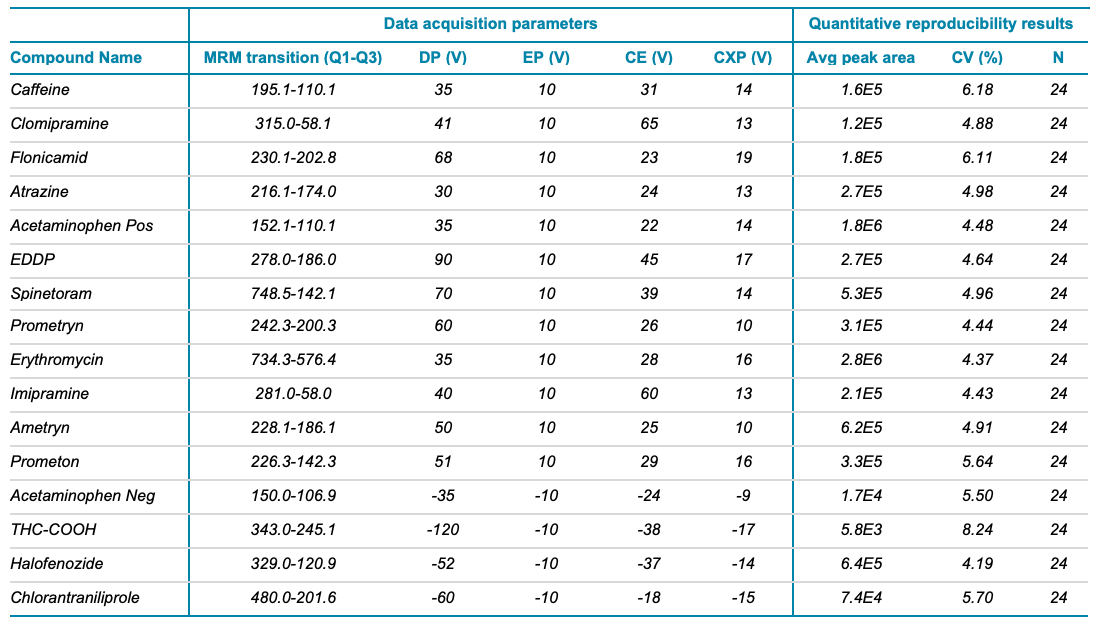
Figure 5 shows the XICs of the 16 MRMs to highlight the quality of the data. Good peak shape was observed for all compounds and baseline resolution was achieved at the sample acquisition rate of 1 sec/sample. High reproducibility was observed for all compounds (<7% CV) except for THC-COOH, presumably due to its low signal intensity (Table 1).
The “Cassetting” function in the software can also be used for manual grouping by the user based on preference, as long as the Q1 m/z are not too close to each other (termed “Mass Interference Level” in the software). Three methods can be used for automatic grouping: 1) Group of n compounds, 2) Group every nth compound and 3) Group All compounds.
Figure 5. Extracted ion chromatograms (XICs) for the 15 compounds analyzed with 16 MRMs. Very good peak shape was obtained with baseline resolution between each ejection using a sample acquisition rate of 1 sec/sample.
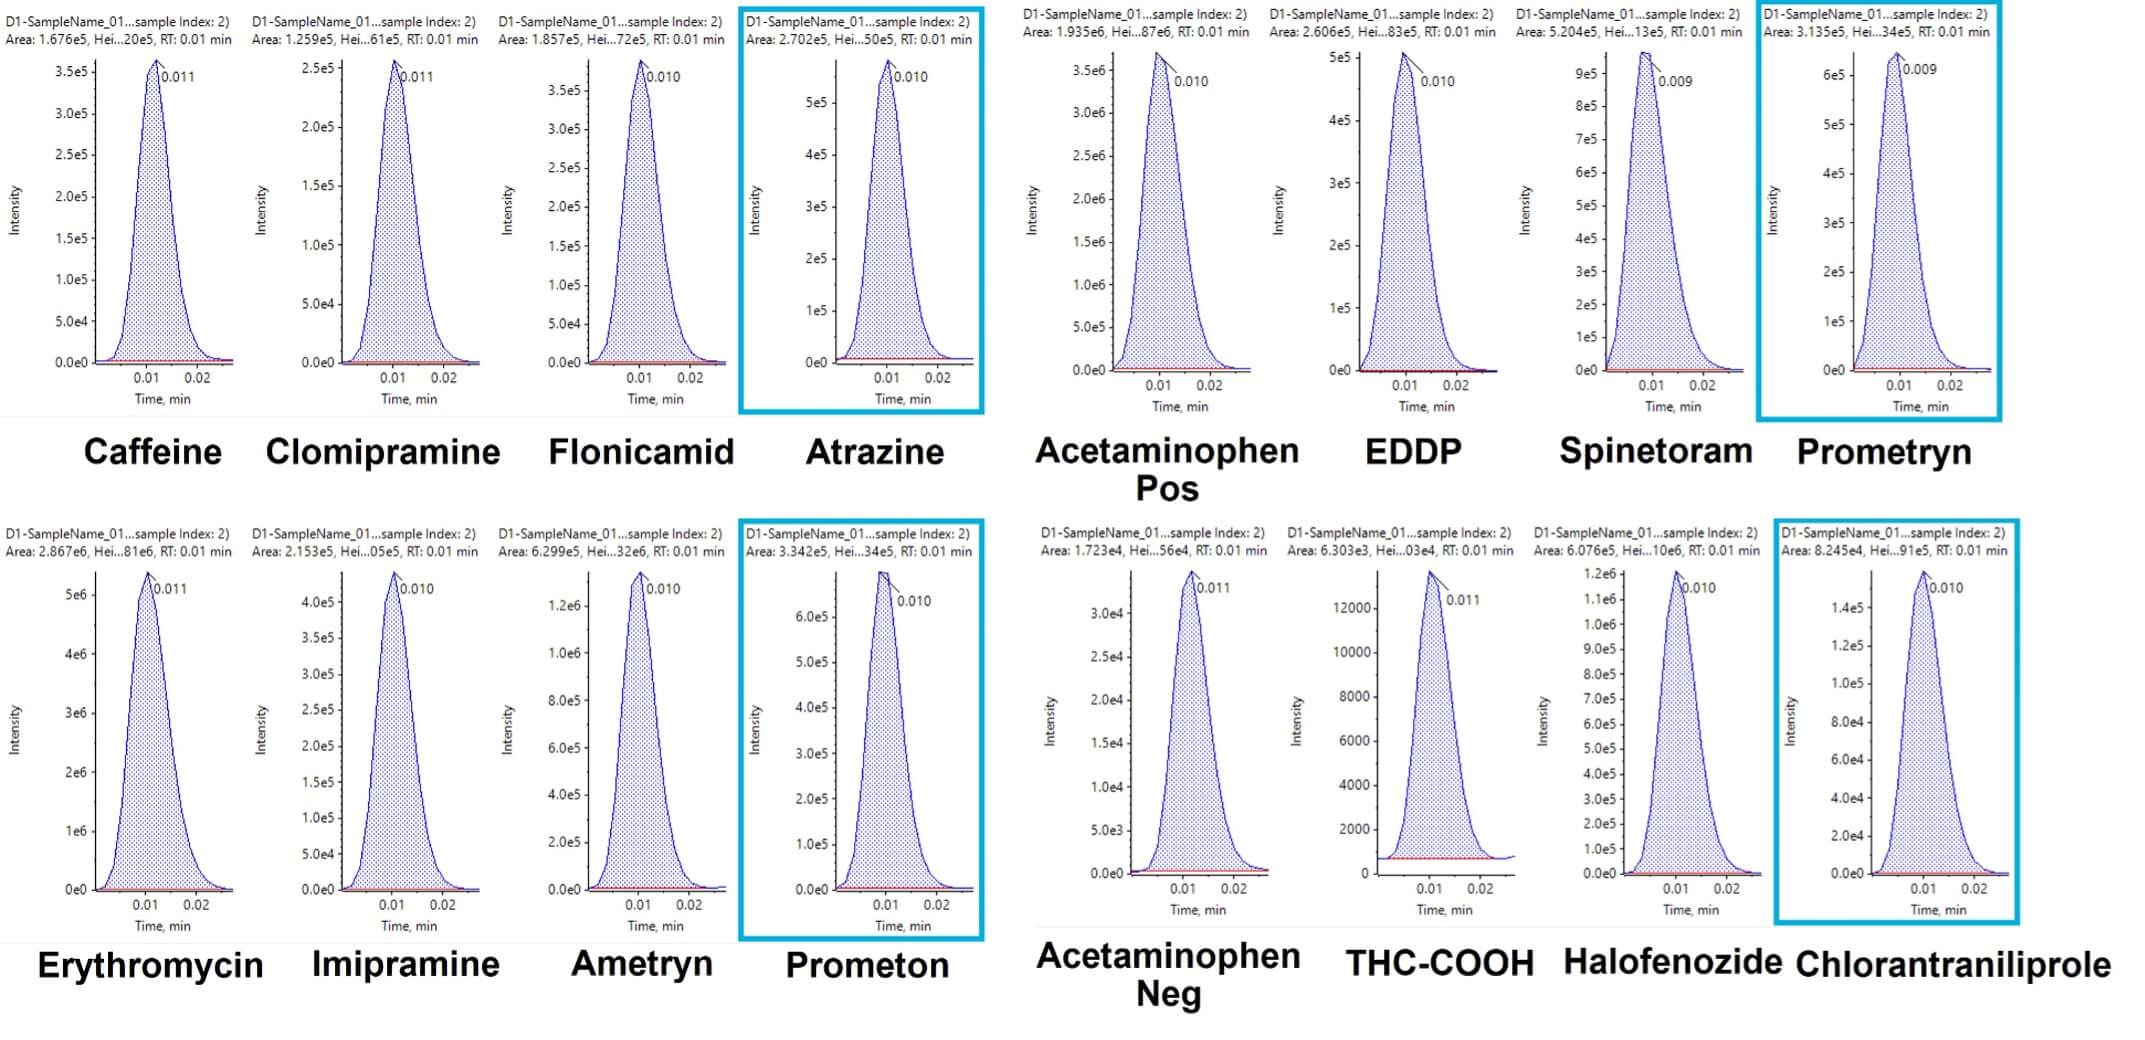
Table 1. Reproducibility of the 15 compounds analyzed with 16 MRMs and optimized MS parameters.
Quantitative analysis
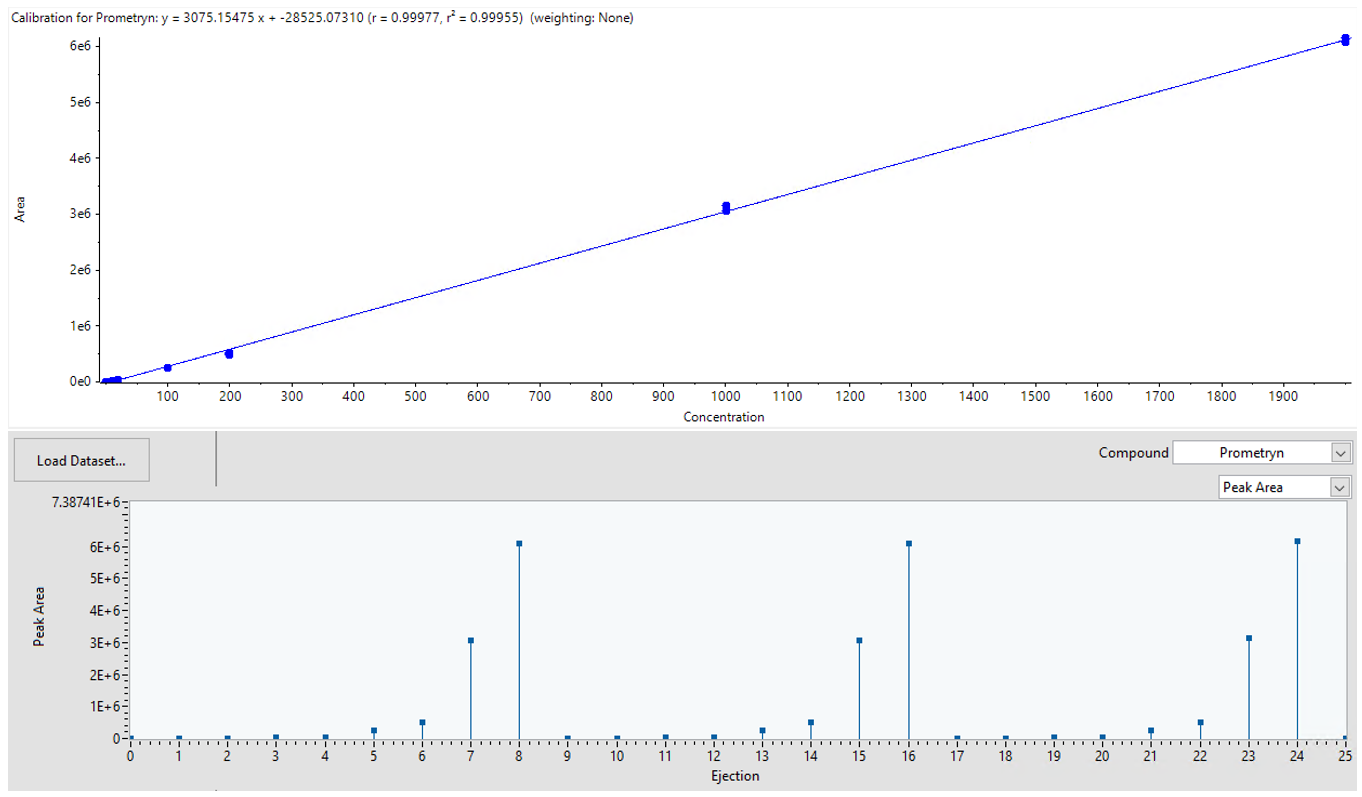
The Import File sample list can also be used to generate standard calibration curves for quantitative analysis. Samples were prepared as a series of 7 dilutions of the Triazine Pesticides Mix, which contains 4 compounds. Biological triplicates were analyzed at each standard concentration. A total of 6 batches were automatically generated using LeadScape Analyze software and acquired using the Echo MS system. Results were automatically generated and then viewed in SCIEX OS software. Very good linearity (R2 ≥ 0.995) and reproducibility were observed across 3 orders of linear dynamic range (2–2000 ng/mL) for all the batches (Table 2). An example of the results in which good linearly was observed for prometryn is shown in Figure 6A.
The quantitative results can also be reviewed in LeadScape Analyze software. Upon completion of data acquisition, the results file is automatically generated and imported into LeadScape Analyze software.2 Figure 6B shows a bar graph of peak areas for triplicate analyses of prometryn at each concentration level. Any compound can be selected from the compound list and displayed based on peak area, peak height or peak width in the graph window (Figure 6B) or in tabular format. Hence, the results review function in LeadScape Analyze software allows users to quickly access quantitative trends and evaluate the data quality.
Table 2. Reproducibility (R2) of the triazine calibration curve. Six replicate batches were performed to demonstrate reproducibility.
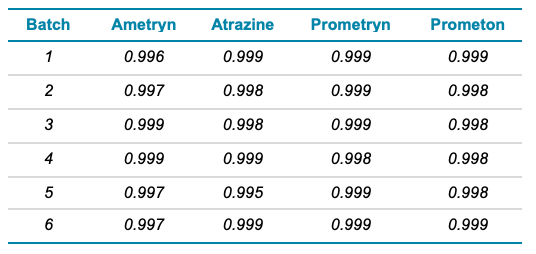
Figure 6. Results review of prometryn from batch 5 in SCIEX OS software and LeadScape Analyze software. A) The calibration curve generated in the SCIEX OS software shows good linearity and reproducibility (R ≥ 0.999) for the biological triplicates analyzed at each concentration level. B) The bar graph of peak areas for the biological triplicates analyzed at each concentration level in the LeadScape Analyze software.
Multiple MRM transitions per compound
Compounds can be monitored using multiple Q3 fragments in LeadScape Analyze software when both quantifier and qualifier MRM transitions are desired. This allows users to assess ion ratios to monitor for potential interferences across many samples. To acquire data in this manner, the multi-fragment monitoring function is required. In LeadScape Analyze software, a value from 1 to 7 can be selected to indicate the number of fragments to be returned from the DiscoveryQuant software database. The user can then decide which fragments will be used for creating the MRM method. Batch creation and submission is then executed, as described above.
Conclusions
The Echo MS system with a SCIEX Triple Quad 6500+ mass spectrometer is a high-throughput MS system that provides sensitive, accurate and reproducible results at the speed of a plate reader, using Acoustic Droplet Ejection and the Open Port Interface. This system has now been integrated with LeadScape Analyze software to provide automatic method creation and batch generation, which leads to increased throughput and accelerated turnaround times for ADME studies.
- LeadScape software is easy to use and reduces user errors, with only 5 steps between loading batch files and obtaining usable results with minimal user interaction
- LeadScape software allows the import of many compounds to automatically build multiple acquisition methods
- The Echo MS system with LeadScape Analyze software is a HT-ADME solution with reduced sample consumption, no LC system components and low operating costs that can support larger campaigns, test more lead compounds and accelerate results delivery
References
- Rapid MS/MS analysis with Acoustic Ejection Mass Spectrometry (AEMS) - Using the SCIEX Echo® MS system to break bottlenecks in quantitative mass spectrometry throughput. SCIEX technical note, RUO-MKT-02-11385-A.
- Accelerating turnaround time in high-throughput ADME pipelines. SCIEX technical note, RUO-MKT-02-14235-A.
- 10x increased throughput for metabolic stability assays. SCIEX technical note, RUO-MKT-02-14849-A.