Microflow SWATH® Acquisition for industrialized quantitative proteomics
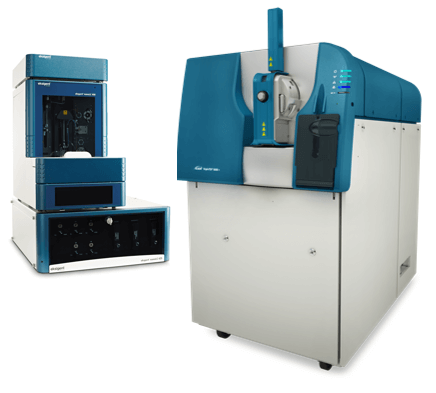
NanoLC™ 400 System with TripleTOF® 6600 System
Christie L Hunter1, Nick Morrice2
1SCIEX, USA, 2SCIEX, UK
Abstract
Data independent acquisition (DIA) strategies are being used increasingly in larger scale protein biomarker research studies due to the demonstrated advantages of the technique, mainly increased comprehensiveness of data collection while maintaining high quantitative reproducibility. Here, SWATH® Acquisition was coupled with microflow chromatography to obtain higher throughput and robustness for large studies and the impact on quantitative results was explored. Using a 1 hour total run time per sample, many method parameters were optimized. Final results demonstrated that with this strategy, ∼23-24 samples/day could be analyzed (∼150 proteomes per week) and 4500-5000 proteins were reliably identified and quantified with CV <20% from cell lysate.
Introduction
Data independent acquisition (DIA) strategies have been used to increase the comprehensiveness of data collection while maintaining high quantitative reproducibility. In DIA, larger width Q1 windows are stepped across the mass range in an LC timescale, transmitting populations of peptides for fragmentation, and high resolution MS and MS/MS spectra are acquired. Many labs are now using DIA to perform larger scale quantitative proteomic experiments with solid reproducibility on 1000s of proteins in complex matrices. As this technique increasingly proves to be a solid tool for biomarker research, larger sample sets are being analyzed, driving the need for workflow improvements that provide more throughput and higher robustness.
Nanoflow LC can provide high sensitivity and high quality separations for quantitative proteomics however the technique is relatively low throughput. Microflow LC provides higher throughput with a small loss in overall workflow sensitivity3. Here, microflow LC was investigated in combination with SWATH Acquisition on a complex matrix, to assess depth of coverage and robustness relative to current nanoflow strategies.
Figure 1. Industrializing proteomics with microflow SWATH Acquisition. SWATH Acquisition provides robust quantitation on large numbers of proteins from proteomic samples. In combination with higher flow chromatography, the robustness of the technique can be greatly enhanced as well as the sample throughput. This will allow the analysis of larger sample sets to answer bigger biological questions.
Key features of microflow SWATH® Acquisition on TripleTOF Systems
- High sensitivity, resolution and speed of MS/MS acquisition on the TripleTOF Systems
- Enables the use of 100 Q1 window isolation1,2 for improved data quality through increased specificity
- Variable sized Q1 windows optimized based on precursor density further increases specificity while ensuring broad mass range coverage2.
- NanoLC™ 400 system can be readily switched between nanoflow and microflow chromatography, depending on workflow needs
- Microflow LC provides enhanced workflow robustness and sample throughput for SWATH Acquisition
Methods
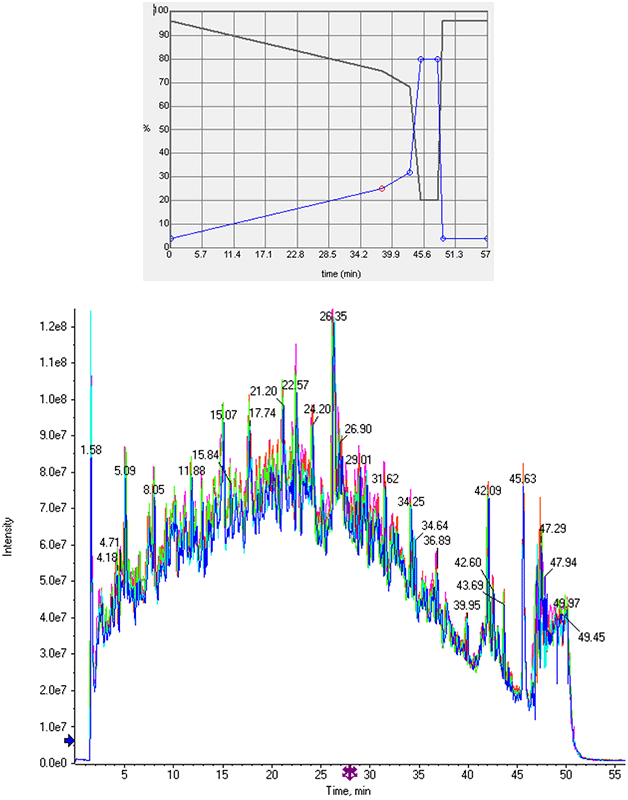
Chromatography: Separation of a trypsin digest of HEK cell lysate5 was performed on a NanoLC™ 425 System (SCIEX) operating in direct injection mode at microflow rates. A 0.3x150 cm ChromXP™ column (SCIEX) was used with a short gradient (4-32% solvent B in 43 min, B: 95% ACN , 0.1 formic acid in water) at 5 µL/min (total run time 57min, Figure 2). Total protein injected on column ranged from 1 – 8 µg.
Mass spectrometry: The MS analysis was performed on a TripleTOF 6600 System (SCIEX) using a Turbo V™ Source with a 25 μm I.D. hybrid electrodes (SCIEX). Variable window SWATH Acquisition methods were built using Analyst® TF Software 1.7.
Data processing: Replicate injections of each acquisition condition were processed using SWATH Acquisition microapp 2.0 in PeakView® Software 2.2 using the Pan Human SWATH Ion Library4. Modified and shared peptides were specifically excluded from quantitation. Results analysis was performed in Excel using the SWATH Replicates template. All protein and peptide numbers reported were determined at <1%FDR and <20% CV across the 5 SWATH Acquisition replicates collected.
Figure 2. One hour per sample use case for cell lysates. A gradient was optimized to provide good separation of the cell lysates but also to be finished in less than 1 hour total run time (top). Very high retention time and total ion chromatogram (TIC) reproducibility was observed for this optimized gradient (bottom). This workflow allows for 20-24 samples per day to be analyzed with SWATH Acquisition. Five replicate injections were performed for each experimental condition tested such that the # of proteins / peptides at <1% FDR and < 20% CV could be determined.
Robustness of microflow LC
By moving up in flowrate, from 300 nL/min to 5 µL/min, a significant improvement in ease of operation is achieved. Flow path connections are more straightforward to make, and any leaks or dead volumes are more readily found and fixed. Instead of using the NanoSpray® Source for ionization, a high flow source (either Turbo V™ or DuoSpray® Source) can be used in combination with the low flow hybrid electrodes to reduce the post-column dead volumes. Higher flow rates allow faster load and re-equilibration times (Figure 2).
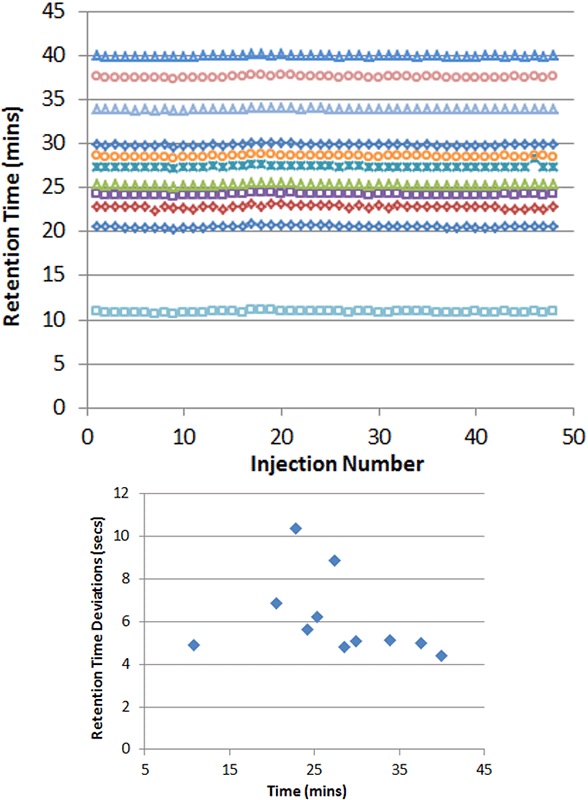
Very solid robustness in retention time is also observed when running microflow LC, even when running complex samples. To illustrate, a set of 48 plasma samples were running over the course of 2.5 days and the retention times of a set of dosed synthetic peptides was monitored. Excellent retention time stability was observed with deviations of 10sec or less across the gradient (Figure 3).
Figure 3. High chromatographic reproducibility. To illustrate the high reproducibility of the microflow LC approach, 48 plasma samples were run in a large batch over the course of 2.5 days. The retention times for the synthetic peptides added were extracted and plotted (top). The retention times deviations were determined and plotted (bottom) and were between 4 to 10 seconds across the chromatographic gradient. This RT reproducibility allows more narrow retention time windows to be used during SWATH Acquisition data extraction.
Optimizing SWATH® Acquisition for microflow LC
There are two modes of MS/MS acquisition on TripleTOF® Systems, the high sensitivity mode (HS >15000 resolution) and the high resolution mode (HR >30000 resolution). When processing SWATH Acquisition data, XICs of the fragment ions are generated and the width of the XIC is optimized according to the spectral peak resolution. Extraction widths of 40 and 75 ppm were used for HR mode and HS mode, respectively (settings which should extract ~80% of the spectral peak area).
Small gains in quantified proteins were observed when high resolution MS/MS mode was used on the two TripleTOF 6600 Systems tested (Figure 4).
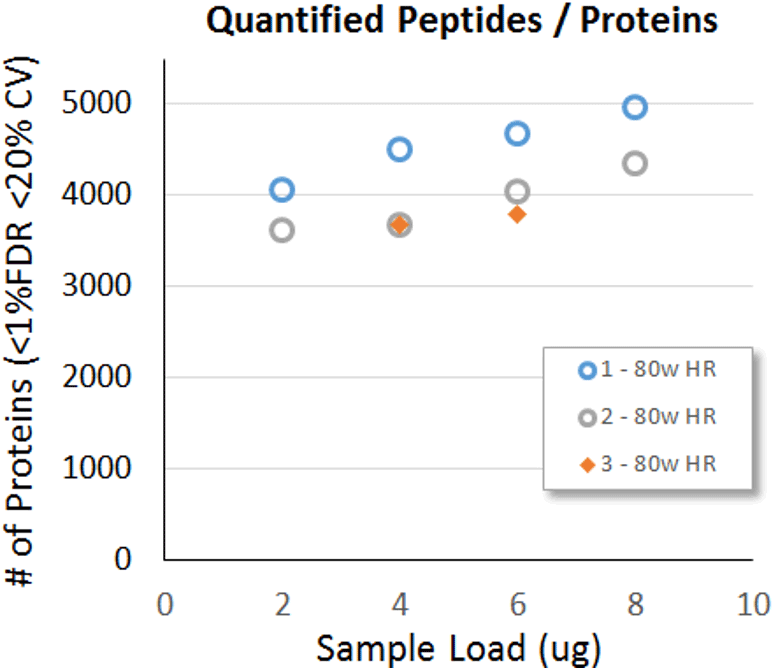
In previous work, the sensitivity differences between different flow rates and columns was evaluated by measuring LLOQs on the QTRAP® 5500 System on a variety of peptides3. The sensitivity loss for moving from nanoflow rates on a 75 µm column to 5 µL/min on a 300 µm column was found to be ~3-4 fold. Therefore, a range of sample loads were explored to compensate for this. Typical nanoflow LC sample loads are 1-2 µg total protein on column, so amounts were increased from there (Figure 5). A steady gain in the number of proteins that could be quantified from a sample increased steadily as the load increased. Multiple human cell line digests on multiple instruments were tested to confirm this observation.
Figure 4. Optimizing MS/MS resolution mode. From high resolution MS/MS spectra (left), the width of the fragment ion XICs generated is adjusted such that a good proportion of the spectral peak area (middle) is extracted. Back to back comparisons were performed on two different TripleTOF 6600 Systems using both MS/MS acquisition modes (High Resolution and High Sensitivity modes) for SWATH Acquisition. The number of quantified proteins (<20% CV and <1% peptide FDR) increased by 15% and 5 % proteins when using the higher resolution MS/MS mode on each instrument. The spectral peak width used to extract the high sensitivity or high resolution spectra was 75 and 40 ppm respectively. |
Figure 5. Protein load testing. A range of sample loadings were explored, up to 8 µg on column was tested on 3 different TripleTOF 6600 Systems running roughly equivalent configurations. Steady gains were found as the load increased from 2 to 8 µg on column. The 3 different instruments showed consistent results. Instrument 1 and 2 used a HEK cell digest and instrument 3 used a K562 cell digest.
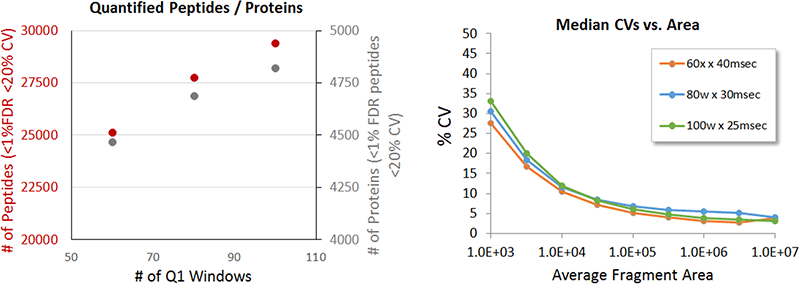
In addition to high retention time robustness, microflow LC also has very good peak shape and separation. For the 1 hour run time studied here, typical peak widths at half height were 10-12 secs. Previous work has shown that using more narrow variable width Q1 windows can improve peptide detection and increase sample coverage1,2. Using a 6 µg sample load, 5 replicates were run using 60, 80 and 100 variable windows, with a 40, 30 and 23 25 msec accumulation time respectively to maintain constant cycle time. Again, a steady gain in the number of proteins (8%) and peptides (17%) reproducibly quantified was observed as the # of windows increased.
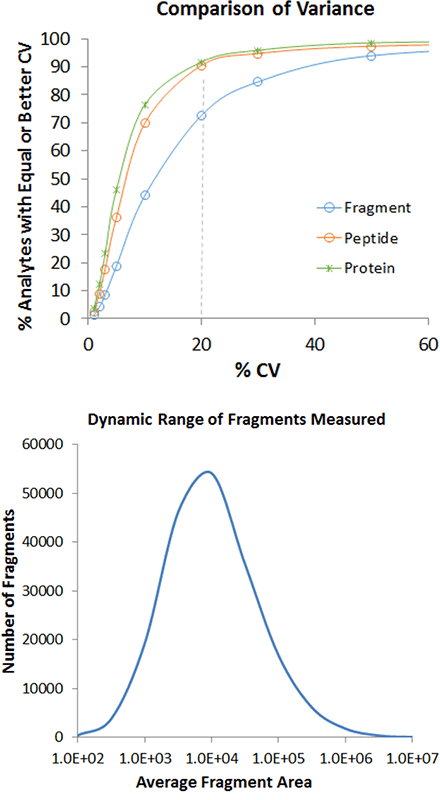
The optimized conditions for this 1 hour total run time, for the conditions explored here, was to use a sample load of 8 µg of total protein on column, to use the 100 variable windows with a 25 msec accumulation time and to operate in the high resolution MS/MS mode. Very high quality data was obtained as shown in Figure 7, with 4963 proteins and 30685 peptides quantified at <1% FDR and <20% CV. From the cumulative %CV plot (Figure 7, top, orange line), ~90% of the peptides were quantified with <20% CV. In addition, the dynamic range of the fragment peak areas covered ~4 orders of dynamic range.
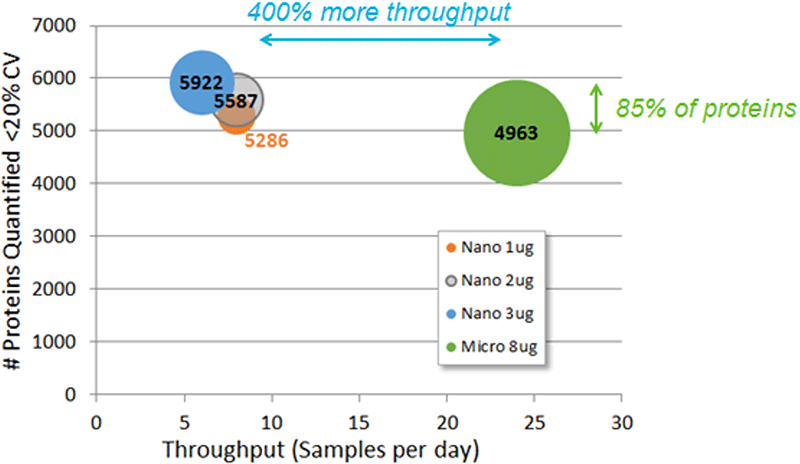
Finally, the results from this study can be compared to data collected previously on the same HEK cell digest using nanoflow LC, in order to understand when to employ the different LC strategies (Figure 8). Microflow provides much higher throughput (up to 400%), and when more material is available (4x more), data for proteins quantified can be obtained that is within 85% of what would have been obtained using nanoflow LC.
Figure 6. Optimizing window strategy. Variable window strategies using 60, 80 and 100 windows were evaluated, with concomitant decrease in accumulation time to maintain an appropriate cycle time. Peptide levels at 6 µg were compared using 60 and 80 windows and a gain of about 15-20% was observed. (Right) When acquiring MS/MS at faster and faster speeds to accommodate more Q1 windows, it is important to ensure that the quantitative quality is not degraded. Here the %CV as a function of intensity is plotted for the 3 experiments, and minimal differences are observed even at the lowest intensity. This indicates that operating as fast as 25 msec per MS/MS still provides high quality quantitation, enabling 100 Q1 windows to be used.
Figure 7. High quality quantitation data. Using an 8 µg load and 80x 30 msec window strategy, 4963 proteins were reproducibly quantified in 1 hour run time. (Top) ~90% of the peptide level data, filtered at a <1% peptide FDR had reproducibility <20%. (Bottom) Plotting the signal intensity of the extracted fragment ions shows quantitative results were obtained over ~4 orders dynamic range.
Figure 8. Comparing microflow to nanoflow workflows. Previous SWATH Acquisition data from nanoflow LC using 1, 2 and 3 µg loads and 2-3 hour gradient (3-4 hour total run time) was compared to this current dataset. In order to represent throughput, the run times were converted to samples per day (x-axis). The # of proteins quantified is plotted on the y-axis (<20% CV and <1% peptide FDR) and the amount of protein loaded on column is represented by the size of the bubble. With these current microflow LC conditions, we can quantify 85% of the proteins quantified with nanoflow rates but with 400% more throughput.
Conclusions
SWATH Acquisition coupled with microflow chromatography provides additional workflow options to researchers with higher throughput and robustness needs.
- Demonstrated throughput enabling ~150 proteomes per week
- 1 hour total run time for up to 24 samples / day
- Quantified 4500-5000 proteins with CV <20%
- SWATH Acquisition provides robust high quality quantitation
- Specificity key element for peptide detection and quantitation
- 80 to 100 variable Q1 windows provides increased peptide detection
- Higher resolution MS/MS (>30000 resolution) also provides increased detection using TripleTOF® 6600 System
References
- Improved data quality using variable Q1 window widths in SWATH® Acquisition, SCIEX technical note RUO-MKT-02-2879-A.
- Evolution of SWATH® Acquisition provides large gains in quantified proteins, SCIEX technical note RUO-MKT-02- 5772-A.
- Exploring the sensitivity differences for peptide quantification in the low flow rate regime - NanoLC™ 400 System for high performance nanoflow and microflow LC, SCIEX technical note RUO-MKT-02-3252-A.
- Rosenberger G et al. (2014) Scientific Data, 1, 140031.
- Thanks to Yansheng Liu in Ruedi Aebersold’s lab at ETH Zurich for supplying the HEK cell lysate.
- Accelerating SWATH® Acquisition for protein quantitation – up to 100 samples per day. SCIEX technical note RUO-MKT-02-8432-A.
 Click to enlarge
 Click to enlarge
 Click to enlarge
 Click to enlarge
 Click to enlarge
 Click to enlarge
 Click to enlarge
 Click to enlarge